Forecast 3 March 2020 (CEP 2020, summary)
Impact of coronavirus COVID-19 on Dutch economy highly uncertain, but steady underlying growth

CPB’s Director, Pieter Hasekamp: ‘It is clear the coronavirus already has a negative effect on the Dutch economy. Without containment of the virus, it will continue to influence economic growth negatively”
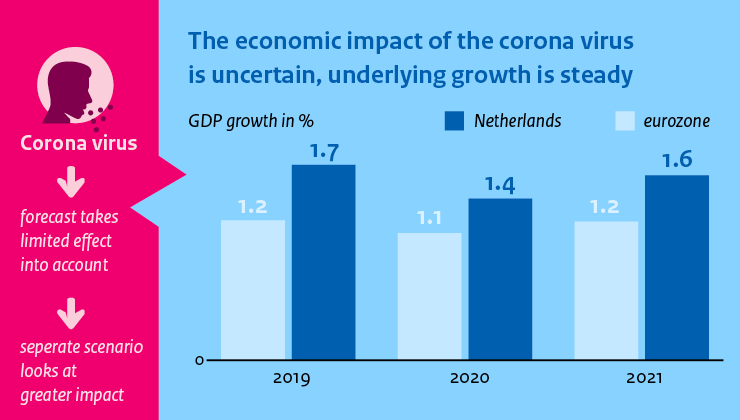
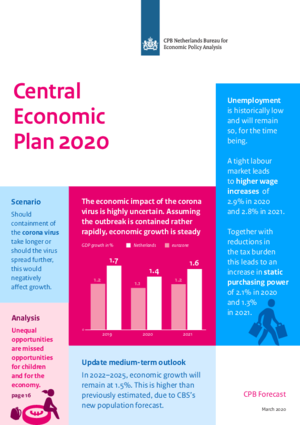
In case of limited effects of the coronavirus (the central scenario), the Netherlands will continue to see steady economic growth, in 2020 and 2021. Given the exceptionally low growth in world trade and the slight growth in the countries surrounding the Netherlands, the Dutch economy is doing relatively well. Unemployment is at a historically low level and is projected to remain low for the time being. The tight labour market is resulting in stronger wage increases. Combined with decreases in the tax burden, this will lead to a 2.1% increase in purchasing power in 2020 and 1.3% in 2021. The budgetary surplus will decrease to 0.1% of GDP.
In its analysis, CPB calls attention to the finding that children of low-income parents have a considerably lower chance of earning a high income themselves than the children of parents who are better off. There is a broad consensus in favour of equal opportunities for children, but the type of family you are born into really makes a difference. Policy that is aimed to increase opportunities, such as investments in preschool education, may help. This will benefit children as well as the economy. Unequal opportunities are missed opportunities.’
| Main Economic Indicators | 2019 | 2020 | 2021 |
| Moderate GDP growth continues | 1.7 | 1.4 | 1.6 |
| Unemployment historically low | 3.4 | 3.2 | 3.4 |
| Inflation down in 2020 | 2.7 | 1.6 | 1.6 |
| Higher CAO wage increases | 2.4 | 2.9 | 2.8 |
| Sizeable increase in purchasing power, partly due to reduction in financial burden | 1.0 | 2.1 | 1.3 |
| Government surplus narrowly positive | 1.7 | 1.1 | 0.1 |
Apart from the coronavirus, there are also other uncertainties surrounding the projections. US trade politics remain unpredictable. And, although a disorderly Brexit has been averted, new uncertainties are looming about the timely creation of a trade relationship between the United Kingdom and the European Union. In the Netherlands, the impact of issues around nitrogen and PFAS remain uncertain, and growth may be higher if wages were to increase more rapidly than foreseen in these projections.
Also in the medium term, growth will remain at around 1.5%, which is substantially higher than reported in CPB’s medium-term outlook of last November. The revision is largely due to the new higher population forecasts by Statistics Netherlands (CBS). Government finances are projected to improve over the coming Cabinet period, because of the higher economic growth, which in turn will lead to the smaller sustainability gap of 0.8%.
Downloads
Vragen en antwoorden:
Waarom brengt het CPB een raming uit als de vooruitzichten zo onzeker zijn?
Het CPB brengt altijd rond deze tijd een raming uit, ook omdat de raming een rol speelt in het begrotingsproces. Daarbij is het goed te bedenken dat een raming altijd onzekerheid kent, en niets meer of minder is dan een inschatting van de economische ontwikkeling op basis van de informatie die bij afsluiting van de raming beschikbaar is. Om de onzekerheid recht te doen, verkennen we in de raming alternatieve scenario’s.
Valt er al iets meer te zeggen over de invloed van de stikstof- en pfas-problematiek?
De bouw ondervindt hinder van de stikstof- en pfas-problematiek. De precieze invloed hiervan is nog moeilijk in te schatten, maar de laatste cijfers over verwachtingen en orderomzet in de bouw lijken te wijzen op een wat groter effect dan eerder gedacht. In deze raming is rekening gehouden met een negatief bbp-effect van 0,2% in 2020 en 0,1% in 2021. Mede door de lagere bouwproductie blijft de woningmarkt krap.

Downloads
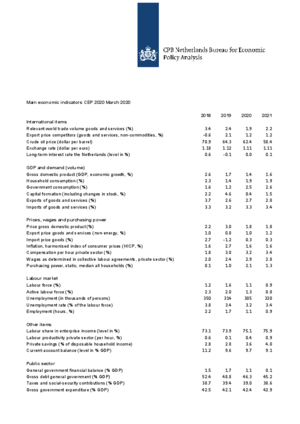
Table 'Main economic indicators', 2018-2021, March 2020
| 2018 | 2019 | 2020 | 2021 | |
| Relevant world trade volume goods and services (%) | 3.4 | 2.4 | 1.9 | 2.2 |
| Export price competitors (goods and services, non-commodities, %) | -0.6 | 2.1 | 1.2 | 1.2 |
| Crude oil price (dollar per barrel) | 70.9 | 64.3 | 62.4 | 58.4 |
| Exchange rate (dollar per euro) | 1.18 | 1.12 | 1.11 | 1.11 |
| Long-term interest rate the Netherlands (level in %) | 0.6 | -0.1 | 0.0 | 0.1 |
| 2018 | 2019 | 2020 | 2021 | |
| Gross domestic product (GDP, economic growth, %) | 2.6 | 1.7 | 1.4 | 1.6 |
| Household consumption (%) | 2.3 | 1.4 | 1.9 | 1.9 |
| Government consumption (%) | 1.6 | 1.2 | 2.5 | 2.6 |
| Capital formation including changes in stock (%) | 2.2 | 4.6 | 0.4 | 1.5 |
| Exports of goods and services (%) | 3.7 | 2.6 | 2.7 | 2.8 |
| Imports of goods and services (%) | 3.3 | 3.2 | 3.3 | 3.4 |
| 2018 | 2019 | 2020 | 2021 | |
| Price gross domestic product (%) | 2.2 | 3.0 | 1.8 | 1.8 |
| Export price goods and services (non-energy, %) | 1.0 | 0.8 | 1.0 | 1.2 |
| Import price goods (%) | 2.7 | -1.2 | 0.3 | 0.3 |
| Inflation, harmonised index of consumer prices (HICP, %) | 1.6 | 2.7 | 1.6 | 1.6 |
| Compensation per hour private sector (%) | 1.8 | 3.0 | 3.2 | 3.4 |
| Wages as determined in collective labour agreements, private sector (%) | 2.0 | 2.4 | 2.9 | 2.8 |
| Purchasing power, static, median all households (%) | 0.1 | 1.0 | 2.1 | 1.3 |
| 2018 | 2019 | 2020 | 2021 | |
| Labour force (%) | 1.2 | 1.6 | 1.1 | 0.9 |
| Active labour force (%) | 2.3 | 2.0 | 1.3 | 0.8 |
| Unemployment (in thousands of persons) | 350 | 314 | 305 | 320 |
| Unemployed rate (% of the labour force) | 3.8 | 3.4 | 3.2 | 3.4 |
| Employment (hours, %) | 2.2 | 1.7 | 1.1 | 0.9 |
| 2018 | 2019 | 2020 | 2021 | |
| Labour share in enterprise income (level in %) | 73.1 | 73.9 | 75.1 | 75.9 |
| Labour productivity private sector (per hour, %) | 0.6 | 0.1 | 0.4 | 0.9 |
| Private savings (% of disposable household income) | 2.8 | 2.8 | 3.6 | 4.0 |
| Current-account balance (level in % GDP) | 11.2 | 9.6 | 9.7 | 9.1 |
| 2018 | 2019 | 2020 | 2021 | |
| General government financial balance (% GDP) | 1.5 | 1.7 | 1.1 | 0.1 |
| Gross debt general government (% GDP) | 52.4 | 48.8 | 46.3 | 45.2 |
| Taxes and social security contributions (% GDP) | 38.7 | 39.4 | 39.0 | 38.6 |
| Gross government expenditure (% GDP) | 42.5 | 42.1 | 42.4 | 42.9 |
Contacts

Contacts


