August projections 2024 (cMEV 2025)
Growth picks up and purchasing power recovers, public finances deteriorate

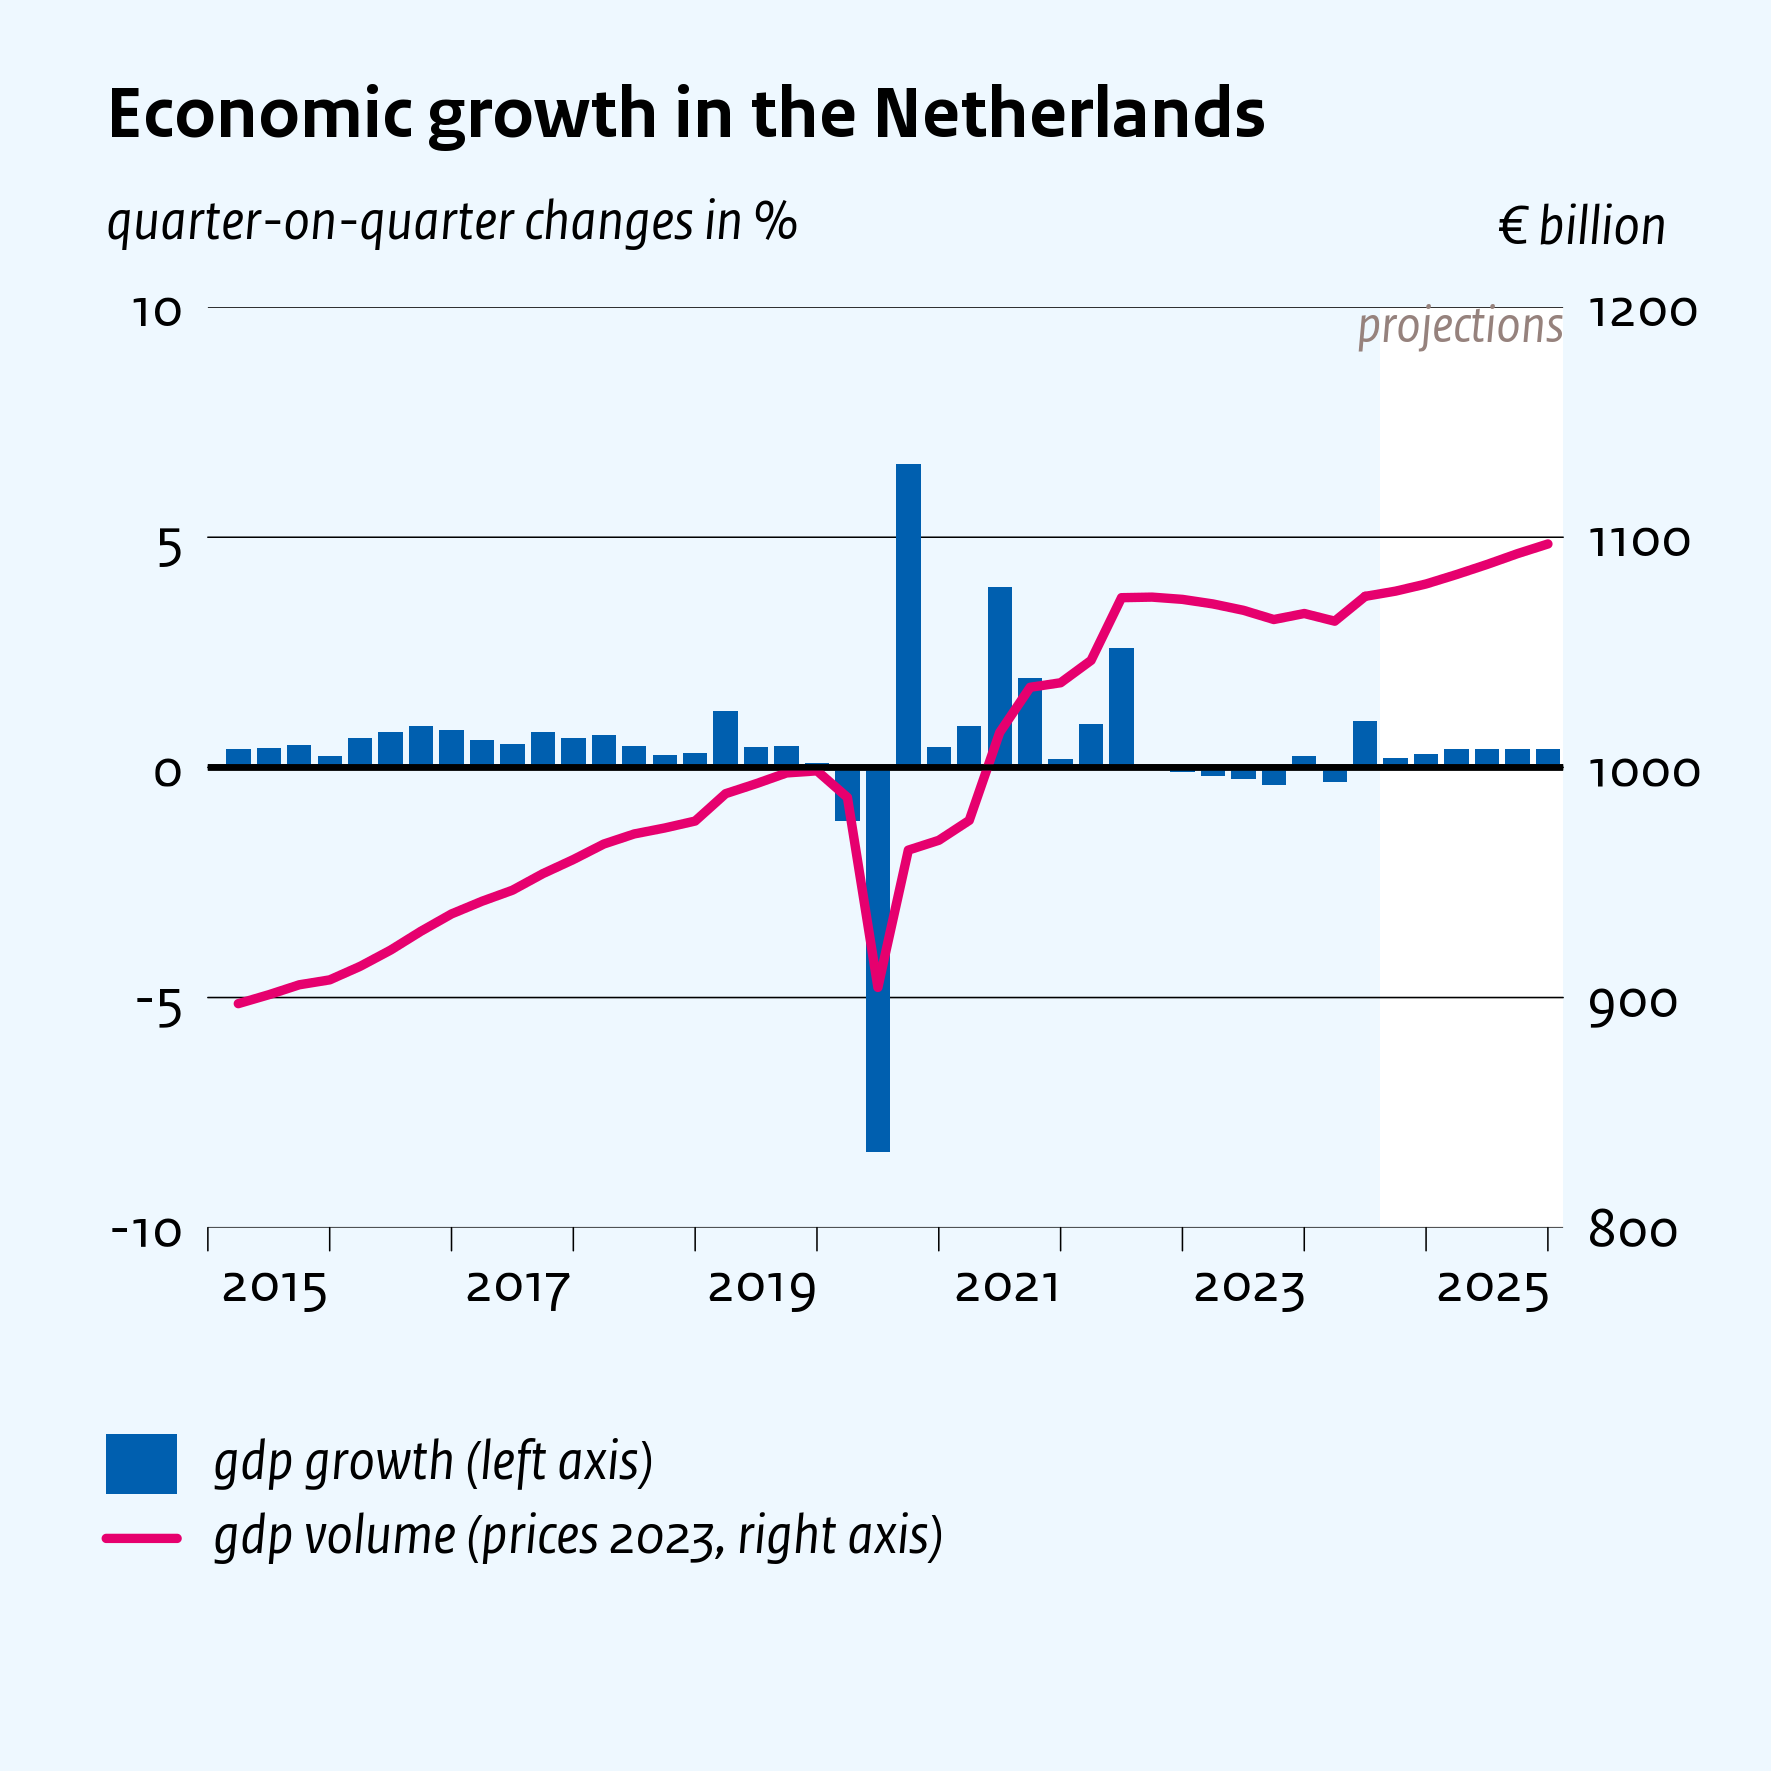
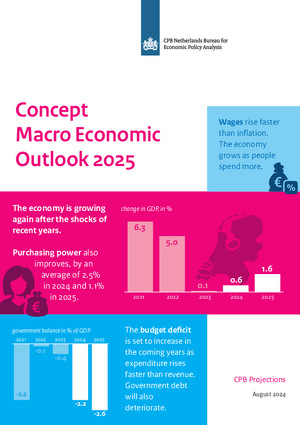
The return to economic growth is partly driven by higher consumption: households have more to spend now that wage growth is well above inflation. Exports are also on the increase due to the upturn in world trade. Although this year’s GDP growth of 0.6% still shows the impact of the meagre results in recent quarters, the signs of economic recovery become more evident in 2025, when GDP growth is expected to reach 1.6%.
Purchasing power
High wage growth has laid a solid foundation for purchasing power to grow in 2024 and 2025. In 2024, median purchasing power is set to increase by 2.5%. This improvement will encompass all groups, with the working population benefiting more than those who receive a pension or income support. In 2025, median purchasing power is set to rise by 1.1%, with a higher increase for those on benefits. The forecast rise in purchasing power for 2025 is significantly higher than stated in the previous estimate. This is primarily due to the reduction in the financial burden outlined in the new government’s coalition agreement.
Public finances
The budget deficit looks set to increase in the coming years, as expenditure rises faster than revenue. The EMU balance has been calculated at -2.6% of GDP for 2025. A debt projection calculated for the Netherlands Fiscal Structural Plan shows that debt could reach 70% of GDP in 2038. This figure does not yet take into account the potential cost of additional climate policies once the existing climate fund expires.
CPB Director Pieter Hasekamp: “While the forecast contains good news for the short term, the situation regarding public finances is in fact deteriorating. Government deficit margins are narrow, heightening the risk of sudden cuts in the event of setbacks. Moreover, the debt projection shows that current policies are shifting the financial burden into the future.”
| 2023 | 2024 | 2025 | 2025-2028 | |
| Return to GDP growth ( % per year) | 0.1 | 0.6 | 1.6 | 1.4 |
| Unemployed remains low (% of the labour force) (a) | 3.6 | 3.7 | 3.9 | 4.5 |
| Purchasing power recovers (median, % per year) | -0.6 | 2.5 | 1.1 | 0.8 |
| Poverty remains low (persons, in %) (a) | 4.6 | 4.5 | 4.1 | 4.3 |
| General deficit deepens (% GDP) (a) | -0.4 | -2.2 | -2.6 | -2.5 |
(a) Column 2025-2028 shows the level in the final year (2028)
Process
This projection forms the basis for the final decisions to be taken this month by the government for the 2025 national budget, which will be published on Budget Day in September. On Budget Day, CPB will publish the Macro Economic Outlook for 2025, which will incorporate the outcome of government’s August deliberations.
Contacts


Downloads
Table 'Main economic indicators', 2022-2025, August 2024
| 2022 | 2023 | 2024 | 2025 | |
| Relevant world trade volume goods and services (%) | 7.8 | -0.4 | 1.1 | 2.8 |
| Export price competitors (goods and services, non-commodities, %) | 15.2 | -1.9 | 1.1 | 1.6 |
| Crude oil price (dollar per barrel) | 100.8 | 82.5 | 83.0 | 77.2 |
| Exchange rate (dollar per euro) | 1.05 | 1.08 | 1.08 | 1.10 |
| Long-term interest rate the Netherlands (level in %) | 1.5 | 2.8 | 2.7 | 2.7 |
| 2022 | 2023 | 2024 | 2025 | |
| Gross domestic product (GDP, economic growth, %) | 5.0 | 0.1 | 0.6 | 1.6 |
| Household consumption (%) | 6.9 | 0.8 | 0.7 | 2.8 |
| Government consumption (%) | 1.3 | 2.9 | 2.6 | 1.3 |
| Capital formation including changes in stock (%) | 5.6 | -9.1 | -3.2 | 3.9 |
| Exports of goods and services (%) | 4.4 | -0.5 | -0.4 | 2.4 |
| Imports of goods and services (%) | 4.4 | -1.8 | -0.7 | 3.7 |
| 2022 | 2023 | 2024 | 2025 | |
| Price gross domestic product (%) | 6.2 | 7.3 | 5.1 | 2.7 |
| Export price goods and services (%) | 19.1 | -0.9 | 1.0 | 1.7 |
| Import price goods and services (%) | 22.1 | -3.4 | -0.7 | 1.4 |
| Inflation, national consumer price index (CPI, %) | 10.0 | 3.8 | 3.6 | 3.2 |
| Alternative CPI (purchasing power and poverty figures) (%) | 6.8 | 7.8 | 3.4 | 3.2 |
| Inflation, harmonised index of consumer prices (HICP, %) | 11.6 | 4.1 | 3.5 | 2.8 |
| Compensation per hour private sector (%) | 3.2 | 6.6 | 7.1 | 5.2 |
| Wages as determined in collective labour agreements, private sector (%) | 3.1 | 5.9 | 6.6 | 4.3 |
| Purchasing power, static, median all households (%) | -2.5 | -0.6 | 2.5 | 1.1 |
| People in poverty (level in %) | 4.8 | 4.6 | 4.5 | 4.1 |
| 2022 | 2023 | 2024 | 2025 | |
| Labour force (%) | 2.4 | 2.0 | 1.0 | 0.6 |
| Active labour force (%) | 3.2 | 2.0 | 0.9 | 0.4 |
| Unemployment (in thousands of persons) | 350 | 359 | 375 | 395 |
| Unemployed rate (% of the labour force) | 3.5 | 3.6 | 3.7 | 3.9 |
| Employment (hours, %) | 3.9 | 1.4 | 0.7 | 0.2 |
| 2022 | 2023 | 2024 | 2025 | |
| Labour share in enterprise income (level in %) | 67.8 | 67.6 | 68.6 | 68.9 |
| Labour productivity private sector (per hour, %) | 1.8 | -1.2 | -0.3 | 1.3 |
| Private savings (% of disposable household income) | 1.3 | 1.9 | 5.6 | 6.4 |
| Current-account balance (level in % GDP) | 6.6 | 9.9 | 10.8 | 10.0 |
| 2022 | 2023 | 2024 | 2025 | |
| General government financial balance (% GDP) | -0.1 | -0.4 | -2.2 | -2.6 |
| Gross debt general government (% GDP) | 48.3 | 45.1 | 45.3 | 46.9 |
| Taxes and social security contributions (% GDP) | 38.1 | 38.6 | 38.1 | 37.8 |
| Gross government expenditure (% GDP) | 43.6 | 43.4 | 44.5 | 44.8 |
Contacts


