Dutch SME bank financing, from a European perspective

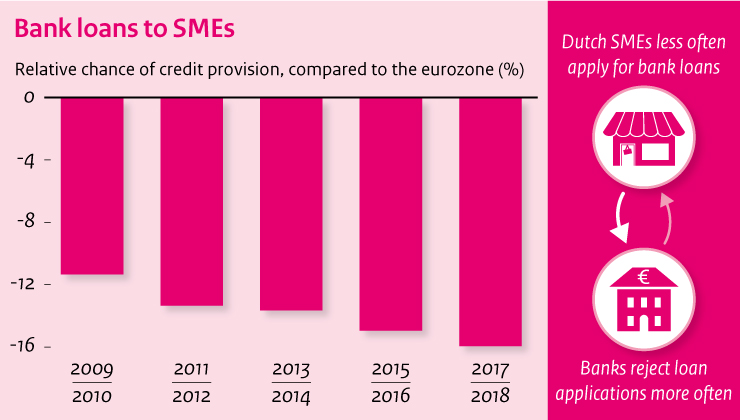
This policy brief confirms that Dutch SMEs are applying for relatively few bank loans, and that those applications are relatively often rejected by the banks. This applies to all businesses but more so to SMEs. The 2009–2018 period shows a steady trend, although in recent years the difference with the eurozone average number of applications has grown, while for the number of rejections the difference has decreased.
Most businesses that do not apply for a loan do so because they have sufficient financial means at their disposal. In addition, in the Netherlands as opposed to elsewhere in Europe, the expectation of a loan application being rejected appears to be a more important reason for not even applying for one. Dutch businesses also appear to make fewer physical investments. A number of possible other explanations, such as a greater reliance on alternative sources of financing, do not seem to play a role.
Downloads
Zie hieronder 2 gerelateerde publicaties: 'Bank credit: Dutch versus European firms' en 'Measuring Credit Rationing of Dutch firms'
To answer the question of whether there are differences in the access to bank loans between Dutch SMEs and SMEs in the rest of the Eurozone we run a linear probability model with controls using microdata from the Survey on Access to Finance (SAFE). SAFE has been conducted semi-annually starting in the fall of 2009. The entire dataset contains over 200,000 firms of which 160,000 are SMEs. We control for turnover, sector, age of the firm and the number of employees within the firm. On top of that, we add the ‘wave’ (the survey round) as a control variable to correct for time-specific effects.
Downloads
The results found in this analysis are robust to several sensitivity analyses. We use different comparison samples, test whether certain periods could be driving the results and estimate a split-sample regression. In all cases we see that Dutch firms apply less and are rejected more often for bank loans. However, this does not mean that we are able to pin down causal effects in this background document. We only report on correlations. More research is necessary to identify relevant causal relationships.
Authors
In this simulation we model credit rationing through bankruptcy costs. To compute the amount of credit rationing we need, firstly, to estimate risks on a firm-by-firm basis, and, secondly, to estimate the bankruptcy costs. We estimate risks using a simple non-parametric approach. We split firms in clusters of similar size and age, and assume that firms within the same cluster face similar risks. We can then use the observed distribution of returns for firms in a given cluster to assess the risks.
Downloads
Under some scenarios, we obtain that the smallest 20% of Dutch firms might have experienced larger credit rationing than the medium-sized firms.
It would be interesting to compare these findings internationally, but there are no comparable simulations for other countries.

