Forecast March 2018 (CEP 2018)
Dutch economy outperforms that of the eurozone

| 2017 | 2018 | 2019 | |
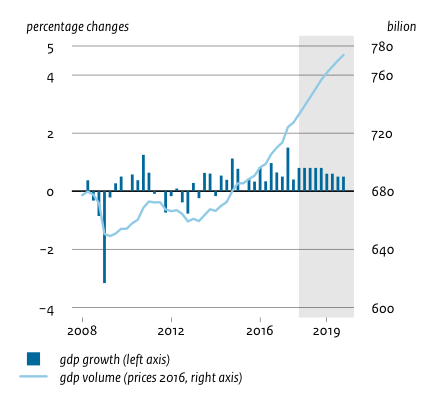
| Gross domestic product (GDP): continued growth | 3.1 | 3.2 | 2.7 |
| Inflation (HICP) on the rise | 1.3 | 1.6 | 2.3 |
| Purchasing power (median, static) rises in 2019 | 0.3 | 0.6 | 1.6 |
| Unemployment (% labour force) falls down | 4.9 | 3.9 | 3.5 |
| EMU balance does not improve, compared to 2017 | 1.1 | 0.7 | 0.9 |
| EMU debt (ultimo year): steady decline | 56.0 | 52.1 | 48.4 |
Unemployment is decreasing rapidly to 3.9% this year, and 3.5% in 2019. The strong growth in employment can easily absorb new entrants into the labour market. Companies offer permanent labour contracts more often, and pay higher wages to either attract or hold on to staff. Rising labour costs and an increase in the low VAT tariff will cause inflation to increase to 2.3% in 2019. Nevertheless, median purchasing power will improve by 1.6% in 2019, because of the higher wages and lower income taxes.
The Dutch economic boom is the result of the favourable international economy, lower interest rates, an expansive budgetary policy, and a persistently strong housing market. These last two factors distinguish the Netherlands from other countries. The projections take a mild Brexit scenario into account in which a trade agreement is reached. However, negative consequences for the economy may increase, substantially, under a chaotic Brexit or in case of a disappointing negotiation result.
The government balance is not projected to improve, despite the booming economy. Last year, the surplus was 1.1% of GDP; it will be 0.7% this year and 0.9% in 2019. The already flourishing economy will be stimulated even further by increased spending on education and defence, and the rising expenditure on health care.
In addition to their focus on the latest economic figures, CPB also points to the limitations of purchasing power trends. Static purchasing power trends may provide insight into the general significance of economy and policy for Dutch citizens, but CPB warns that these trends are less suitable to be translated into personal spending opportunities. Policy may change the distribution range of income, but predicting it down to the smallest detail would ignore the uncertainty that is inextricably linked to projections. The full report, the Central Economic Plan 2018, is to be published on 22 March. It will include the same figures as those presented today. 
Downloads
In this publication CPB presents its analyses and projections of both the Dutch and worldwide economy in 2018 and 2019. The Outlook is only published in Dutch, the download is a translation of chapter 1 of the Dutch publication.
Tekstkaders in CEP 2018
- Koopkrachtplaatjes: wat koop je er voor?
- Brexit in de raming
- CPB aangewezen als National Productivity Board
- Hoe lang houdt de opgaande conjunctuur nog aan?
- Onzekerheid rondom de raming
- Voorspellen van de werkloosheid: kan het beter?
- Contractlonen reageren vertraagd
- Staat het vrijwillig eigen risico in de zorg op gespannen voet met risico-solidariteit?
- Effecten fiscale maatregelen op de (marginale) belastingdruk
- Betere weergave van eigen betalingen Zvw in de koopkracht
- Lastenverzwaring door klimaatbeleid denivelleert, nu en in de toekomst
Fan Charts CEP 2018
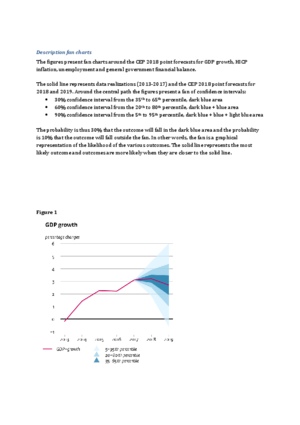
The figures present fan charts around the CEP 2018 point forecasts for GDP growth, HICP inflation, unemployment and general government financial balance.
The solid line represents data realizations (2013-2017) and the CEP 2018 point forecasts for 2018 and 2019. Around the central path the figures present a fan of confidence intervals:
- 30% confidence interval from the 35th to 65th percentile, dark blue area
- 60% confidence interval from the 20th to 80th percentile, dark blue + blue area
- 90% confidence interval from the 5th to 95th percentile, dark blue + blue + light blue area
The probability is thus 30% that the outcome will fall in the dark blue area and the probability is 10% that the outcome will fall outside the fan. In other words, the fan is a graphical representation of the likelihood of the various outcomes. The solid line represents the most likely outcome and outcomes are more likely when they are closer to the solid line.
Downloads
The global economy is flourishing, but also faces certain risks. The global economy is projected to grow by 3.9% in both 2018 and 2019, and world trade will increase by 4.4% in both years. Growth will be widespread, with the exception of the United Kingdom that will lag behind the eurozone. The low pound sterling is affecting purchasing power of UK households and the Brexit is discouraging investments. However, the eurozone has its own vulnerabilities, such as a number of weak banks, the ECB’s limited policy scope in case of a new shock, as well as political uncertainties. Despite the downward risks —also outside Europe— there are no concrete signs of global economic growth already having reached its peak.
The Dutch labour market is tightening. In 2019, unemployment will decrease to 3.5%, its lowest point since 2001. The strong growth in employment can easily absorb the increase in labour supply. Companies more often are offering permanent labour contracts and pay higher wages to either attract or hold on to staff. Rising labour costs and a higher low VAT tariff will cause inflation to increase to 2.4% in 2019. Median static purchasing power will increase by 1.6% in 2019, due to various fiscal measures — which is an improvement compared to the 0.6% increase in 2018.
The budgetary balance is not improving, despite the economic boom. Already implemented policy, higher health care expenditure and increases in spending on education and defence will cause government expenditure to increase by 3.5% in 2018 and 2.4% in 2019. Although tax revenues will increase, the already flourishing economy on balance will be stimulated even further by increased spending on education and defence. In 2018 and 2019, budget surpluses will be 0.7% and 0.9% of GDP, respectively, following the 1.1% of 2017. Future decision-making around natural gas extraction from the Groningerveld will have a negative impact on public finances and economic growth — this has not yet been included in these projections, due to the related uncertainties.
Downloads
De Raad van State heeft er in zijn aanbiedingsbrief van het advies over de begroting 2016 aan de minister van Financiën op gewezen dat toetsing aan de Europese begrotingsregels moeilijk is wanneer de meerjarige begrotingsramingen zijn gebaseerd op een verouderd economisch beeld. Dit geluid is overgenomen in het advies van de Studiegroep Begrotingsruimte . In de bijlage met de begrotingsregels bij de startnota van het huidige kabinet wordt bevestigd dat het CPB jaarlijks een actualisatie van een meerjarige raming maakt, om de kwaliteit en actualiteit van de begrotingsramingen van het kabinet te verbeteren.
Volgens de Wet houdbare overheidsfinanciën dient het begrotingsbeleid gevoerd te worden op basis van macro-economische ramingen van de relevante variabelen van het CPB. De rollende raming verlengt de kortetermijnraming (tot en met jaar t+1) met drie jaar in een technisch scenario. Ze verbetert de kwaliteit van de meerjarige begrotingsramingen van het kabinet door trendbreuken in het meerjarigcijferbeeld te voorkomen. Tot dusver werden voor het lopende en volgende jaar actuele macro-economische cijfers gebruikt, terwijl voor de latere jaren in de kabinetsperiode alleen de jongste middellangetermijnverkenning, veelal die op basis van het Regeerakkoord, beschikbaar was. Voor de jaren na de kabinetsperiode werden ad-hoc-veronderstellingen gemaakt.
Daarnaast maakt de rollende raming het voor het kabinet mogelijk om beter te voldoen aan de Europese rapportageverplichtingen en (zelf) te toetsen aan Europese begrotingsafspraken. Nederland moet jaarlijks het Stabiliteitsprogramma over de stand van zaken van de overheidsfinanciën naar de Europese Commissie sturen. Voor dit Stabiliteitsprogramma zijn cijfers tot en met jaar t+3 vereist.
De rollende raming wijkt af van de andere ramingen van het CPB: de kortetermijnraming en de middellangetermijnverkenning (mlt). Bij een kortetermijnraming wordt een inschatting gemaakt van de ontwikkeling van de conjunctuur, terwijl het technisch scenario vanaf jaar t+2 in de rollende raming geen conjuncturele raming bevat. In plaats daarvan tendeert het technisch scenario, net zoals de mlt, naar een gesloten output gap.
De rollende raming wordt opgesteld met het oog op het Europese Semester en is dan ook minder uitgebreid dan een middellangetermijnverkenning van het CPB. De rollende raming beperkt zich tot een technisch scenario van de economische en budgettaire grootheden en maakt geen update van de gini-coëfficient, de koopkracht en de houdbaarheid, waar dat in een mlt wel gebeurt.
Authors

This document compares the old CPB practice with several alternative forecasting methods for long-term interest rates, and evaluates these methods on the basis of three criteria: (1) forecasting accuracy, (2) internal consistency between short term and medium term, and (3) internal consistency between forecasting short and long-term interest rates. Alternative forecasting methodologies include: the random walk, the term structure, the forward interest swap rates, and two univariate methods (AR(1) and AR(2)). Additionally, we also construct forecasts based on different combinations of the afore-mentioned methods.
Our empirical analyses show that the random walk always performs the best in terms of forecasting accuracy, whereas the forward swap rates have the highest forecasting accuracy except for statistical models (random walk and both AR models). The results are robust in the post-break period and in the presence of the forecast combination. However, we don’t choose the random walk to project long-term interest rates, because random walk projection tends to lead to an inverted yield curve without any economic background. For the old CPB practice, it does not satisfy evaluation criteria (2) and(3), and it provides lower forecasting accuracy than the forward swap rates.
The forward swap rate is a good predictor that meets all criteria. Compared to the other methods this method has several advantages: first, it is consistent for short term and medium term periods; second, both the short-term and long-term forecasts are based on market information; third, it provides higher forecast accuracy than the old CPB practice; finally, the choice of the swap rate is consistent with the current practice of the European Commission to project the long-term rate. Therefore, starting in CEP 2018 we adopt the forward swap rate to project long-term interest rates.
Downloads
Authors
Dit achtergronddocument verkent de inkomenseffecten van het al ingezette energiebeleid tot aan 2030, inclusief de mogelijke gevolgen van het nog te sluiten klimaatakkoord. Met nadruk wijzen we vooraf op het verkennende karakter van de simulaties, met name de scenario’s die we doorrekenen van een nog te sluiten klimaatakkoord. Een beperking in de analyse is dat we (zoals gebruikelijk) de statische koopkrachtdefinitie hanteren voor het berekenen van de inkomenseffecten. Dat wil zeggen dat we geen rekening houden met de precieze effecten van het beleid op het energieverbruik van huishoudens (wel maken we een tentatieve inschatting).
Analyses laten zien dat klimaatbeleid in de vorm van lastenverzwaringen denivellerend uitwerkt. Grosso modo is het inkomenseffect voor de laagste inkomenscategorie (<175% wml) drie keer zo groot als voor de hoogste inkomenscategorie (> 500% wml). Het effect van een hogere energiebelasting voor de laagste inkomenscategorie bedraagt 0,6% in 2019 versus 0,2% voor de hoogste categorie. Afhankelijk van de wijze waarop de beoogde CO2 reductie richting 2030 wordt ingevuld (gebouwde omgeving, mobiliteit, etc.), van de vormgeving van de lastenverzwaring (op energie of algemene lasten, gezinnen of bedrijven), van de mate van afwenteling door bedrijven in de vorm van hogere prijzen en van de vormgeving van het klimaatbeleid in het ons omringende buitenland (vooral mogelijk stijgende elektriciteitsprijzen)), kunnen de verliezen aan de onderkant oplopen tot 3,5%-4% van het besteedbaar inkomen. Mogelijk kunnen energiebesparingen dit met 0,7%-punt verzachten. Eventuele compensatie van de effecten kan ook worden gevonden buiten het klimaatakkoord, maar valt buiten de reikwijdte van dit achtergronddocument.
Authors
NPBs are organisations to investigate and publish on a country’s national productivity. In April 2017, the Dutch Cabinet appointed CPB to be the National Productivity Board for the Netherlands. CPB is in a unique position, as, in the EU, it is often regarded as a model. In this first communication, CPB describes how it will be fulfilling its NPB role.
Over the 1995–2005 period, productivity growth was slightly above one per cent, both in the Netherlands and in other developed nations . In the decade that followed, it slowed down further. This may have been the result of the type of measuring instrument; for example, perhaps the digital economy is being insufficiently represented in the statistics, or perhaps companies have become less innovative. The government has an important role in measuring productivity growth and promoting innovation (one per cent of GDP goes into R&D, each year).
Downloads
Economic growth in the Netherlands, 2008-2019
>
Downloads
Table 'Main economic indicators', 2016-2019, March 2018, (a)
| 2016 | 2017 | 2018 | 2019 | |
| Relevant world trade volume goods and services (%) | 4.0 | 4.7 | 4.4 | 4.4 |
| Export price competitors (goods and services, non-commodities, %) | -3.6 | 1.6 | -0.2 | 1.1 |
| Crude oil price (dollar per barrel) | 43.5 | 54.0 | 67.7 | 63.6 |
| Exchange rate (dollar per euro) | 1.11 | 1.13 | 1.22 | 1.22 |
| Long-term interest rate the Netherlands (level in %) | 0.3 | 0.5 | 0.7 | 0.9 |
| 2016 | 2017 | 2018 | 2019 | |
| Gross domestic product (GDP, economic growth, %) | 2.2 | 3.1 | 3.2 | 2.7 |
| Consumption households (%) | 1.6 | 1.8 | 2.1 | 2.5 |
| Consumption general government (%) | 1.2 | 0.9 | 3.0 | 2.4 |
| Capital formation including changes in stock (%) | 3.1 | 5.0 | 6.0 | 4.2 |
| Exports of goods and services (%) | 4.3 | 5.5 | 4.9 | 4.6 |
| Imports of goods and services (%) | 4.1 | 4.9 | 5.1 | 5.2 |
| 2016 | 2017 | 2018 | 2019 | |
| Price gross domestic product (%) | 0.6 | 1.3 | 1.8 | 2.4 |
| Export price goods and services (non-energy, %) | -0.9 | 1.9 | 0.6 | 1.4 |
| Import price goods (%) | -4.4 | 4.5 | 1.0 | 0.3 |
| Inflation, harmonised index of consumer prices (hicp, %) | 0.1 | 1.3 | 1.6 | 2.3 |
| Compensation per hour private sector (%) | 0.6 | 1.5 | 2.9 | 4.0 |
| Contractual wages private sector (%) | 1.5 | 1.6 | 2.2 | 3.2 |
| Purchasing power, static, median, all households (%) | 2.6 | 0.3 | 0.6 | 1.6 |
| 2016 | 2017 | 2018 | 2019 | |
| Labour force (%) | 0.4 | 0.8 | 1.0 | 1.0 |
| Active labour force (%) | 1.3 | 2.1 | 2.0 | 1.5 |
| Unemployment (in thousands of persons) | 538 | 438 | 355 | 320 |
| Unemployed rate (% of the labour force) | 6.0 | 4.9 | 3.9 | 3.5 |
| Employment (hours, %) | 2.0 | 1.7 | 1.9 | 1.5 |
| 2016 | 2017 | 2018 | 2019 | |
| Labour share in enterprise income (level in %) | 72.9 | 71.8 | 71.7 | 72.5 |
| Labour productivity private sector (per hour, %) | 0.4 | 1.6 | 1.4 | 1.3 |
| Private savings (% of disposable household income) | 0.3 | -0.3 | 0.0 | 0.2 |
| Current-account balance (level in % GDP) | 8.7 | 9.5 | 9.4 | 9.2 |
| 2016 | 2017 | 2018 | 2019 | |
| General government financial balance (% GDP) | 0.4 | 1.1 | 0.7 | 0.9 |
| Gross debt general government (% GDP) | 61.8 | 56.0 | 52.1 | 48.4 |
| Taxes and social security contributions (% GDP) | 38.8 | 38.9 | 38.9 | 39.1 |
| Gross government expenditure (% GDP) | 43.8 | 43.1 | 42.6 | 42.2 |
(a) CPB uses as of MEV 2019 a new method for the calculation of the labour share in enterprise income. This new method takes better account of the income of self-employed persons and therefore better matches current economic reality. A joint 'notitie' of CBS, CPB and DNB is available on this subject (only in Dutch).
