Projections June 2021
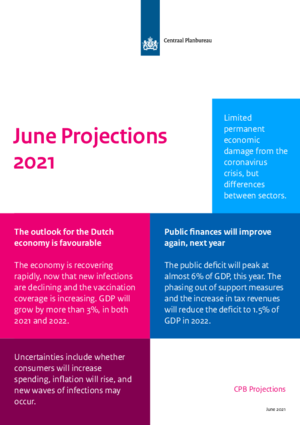
CPB: favourable outlook for the Dutch economy

Pieter Hasekamp, CPB Director: ‘We are experiencing a remarkable crisis. A crisis characterised by substantial decreases in production levels in certain sectors, followed by a strong recovery, as soon as the COVID-19 situation will allow for the related measures to be relaxed. The support policy has been very effective in cushioning the effects on both the labour market and production, thus preventing major permanent damage. The Dutch economy is in relatively good shape despite the pandemic. The recovery policy should now focus on facilitating adjustments to the economy and be connected to long-term challenges on energy, education, the housing market and the labour market.’
| Baseline scenario projections: | 2020 | 2021 | 2022 |
| Strong recovery of GDP growth (% growth) | -3.7 | 3.2 | 3.3 |
| Limited increase in coronavirus-related unemployment (%) | 3.8 | 3.6 | 4.1 |
| Inflation increases (HICP, %) | 1.1 | 2.0 | 1.8 |
| Drop in static purchasing power next year (% growth) | 2.5 | 0.6 | -0.3 |
| Expiration of support measures cause budget deficit to decrease in 2022 (% of GDP) | -4.3 | -5.9 | -1.5 |
| Government debt ratio will already decline, next year (% of GDP) | 54.5 | 58.0 | 56.3 |
Wage increases
Wage increases in new collective labour agreements (CAOs) are being tempered by the fact that some companies, particularly in the services sector, continue to be in a weak financial position. These effects are expected to continue into 2022. For the market sector, the annual CAO wage increase will decline from 2.8% in 2020 to 1.7% in 2021 and 1.8% in 2022. This means that the increase in CAO wages in 2021 is lagging behind price increases. Under unchanging policy, purchasing power will decrease by 0.3%, next year.
Public deficit
The public deficit is projected to peak at almost 6% of GDP, this year, and subsequently to decrease to 1.5% in 2022, thanks to the expiration of Covid support measures and the increase in tax revenues. As a result, the debt ratio will decline by 1.7 percentage points to 56.3% of GDP, next year.
Uncertainties
Economic recovery may be even stronger than assumed in the baseline projections. This may happen if the savings rate, the share of net income saved by households, declines towards its previous level and there is a related increase in private consumption. However, a new COVID-19 flare up can also not be excluded, in which case new social distancing measures could again slow down economic recovery. Inflation development is an uncertain factor, under all scenarios.
Downloads
Fan Charts June 2021
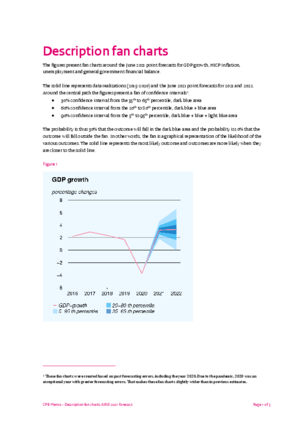
The figures present fan charts around the Projections June 2021 point forecasts for GDP growth, HICP inflation, unemployment and general government financial balance.
The solid line represents data realizations (2015-2020) and the Projections June 2021 point forecasts for 2021 and 2022. Around the central path the figures present a fan of confidence intervals:
- 30% confidence interval from the 35th to 65th percentile, dark blue area
- 60% confidence interval from the 20th to 80th percentile, dark blue + blue area
- 90% confidence interval from the 5th to 95th percentile, dark blue + blue + light blue area
The probability is thus 30% that the outcome will fall in the dark blue area and the probability is 10% that the outcome will fall outside the fan. In other words, the fan is a graphical representation of the likelihood of the various outcomes. The solid line represents the most likely outcome and outcomes are more likely when they are closer to the solid line.
Downloads
Contacts


Downloads
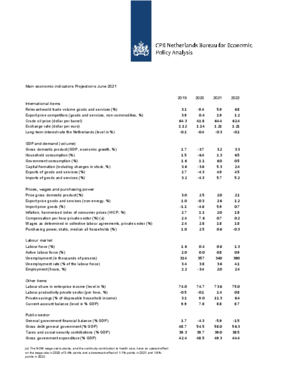
Table 'Main economic indicators', 2019-2022, June 2021
| 2019 | 2020 | 2021 | 2022 | |
| Relevant world trade volume goods and services (%) | 3.1 | -9.4 | 5.9 | 6.8 |
| Export price competitors (goods and services, non-commodities, %) | 3.9 | 0.4 | 1.9 | 1.2 |
| Crude oil price (dollar per barrel) | 64.3 | 41.8 | 64.4 | 62.4 |
| Exchange rate (dollar per euro) | 1.12 | 1.14 | 1.21 | 1.21 |
| Long-term interest rate the Netherlands (level in %) | -0.1 | -0.4 | -0.3 | -0.1 |
| 2019 | 2020 | 2021 | 2022 | |
| Gross domestic product (GDP, economic growth, %) | 1.7 | -3.7 | 3.2 | 3.3 |
| Household consumption (%) | 1.5 | -6.4 | 1.3 | 6.5 |
| Government consumption (%) | 1.6 | 1.1 | 6.0 | 0.5 |
| Capital formation including changes in stock (%) | 3.6 | -3.6 | 5.3 | 2.4 |
| Exports of goods and services (%) | 2.7 | -4.3 | 4.9 | 4.5 |
| Imports of goods and services (%) | 3.2 | -4.3 | 5.7 | 5.2 |
| 2019 | 2020 | 2021 | 2022 | |
| Price gross domestic product (%) | 3.0 | 2.5 | 2.0 | 2.1 |
| Export price goods and services (non-energy, %) | 1.0 | -0.3 | 2.6 | 1.2 |
| Import price goods (%) | -1.1 | -4.6 | 5.9 | 0.7 |
| Inflation, harmonised index of consumer prices (HICP, %) | 2.7 | 1.1 | 2.0 | 1.8 |
| Compensation per hour private sector (%) (a) | 2.4 | 7.6 | 0.7 | 0.2 |
| Wages as determined in collective labour agreements, private sector (%) | 2.4 | 2.8 | 1.8 | 1.8 |
| Purchasing power, static, median all households (%) | 1.0 | 2.5 | 0.6 | -0.3 |
| 2019 | 2020 | 2021 | 2022 | |
| Labour force (%) | 1.6 | 0.4 | 0.6 | 1.3 |
| Active labour force (%) | 2.0 | 0.0 | 0.8 | 0.9 |
| Unemployment (in thousands of persons) | 314 | 357 | 340 | 390 |
| Unemployed rate (% of the labour force) | 3.4 | 3.8 | 3.6 | 4.1 |
| Employment (hours, %) | 2.2 | -3.4 | 2.0 | 2.4 |
| 2019 | 2020 | 2021 | 2022 | |
| Labour share in enterprise income (level in %) | 74.0 | 74.7 | 73.6 | 75.0 |
| Labour productivity private sector (per hour, %) | -0.5 | -0.1 | 1.4 | 0.8 |
| Private savings (% of disposable household income) | 3.1 | 9.0 | 11.3 | 6.4 |
| Current-account balance (level in % GDP) | 9.9 | 7.8 | 8.8 | 8.7 |
| 2019 | 2020 | 2021 | 2022 | |
| General government financial balance (% GDP) | 1.7 | -4.3 | -5.9 | -1.5 |
| Gross debt general government (% GDP) | 48.7 | 54.5 | 58.0 | 56.3 |
| Taxes and social security contributions (% GDP) | 39.3 | 39.7 | 39.0 | 38.5 |
| Gross government expenditure (% GDP) | 42.4 | 48.5 | 49.3 | 44.4 |
(a) The NOW wage cost subsidy, and the continuity contribution to health care, have an upward effect on the wage mutation in 2020 of 3.4%-points and a downward effect of 1.1%-points in 2021 and 1.9%-points in 2022.
Contacts

Contacts


