
Projections August 2023 (cMEV 2024)
Economic growth falls, poverty and government deficit require attention

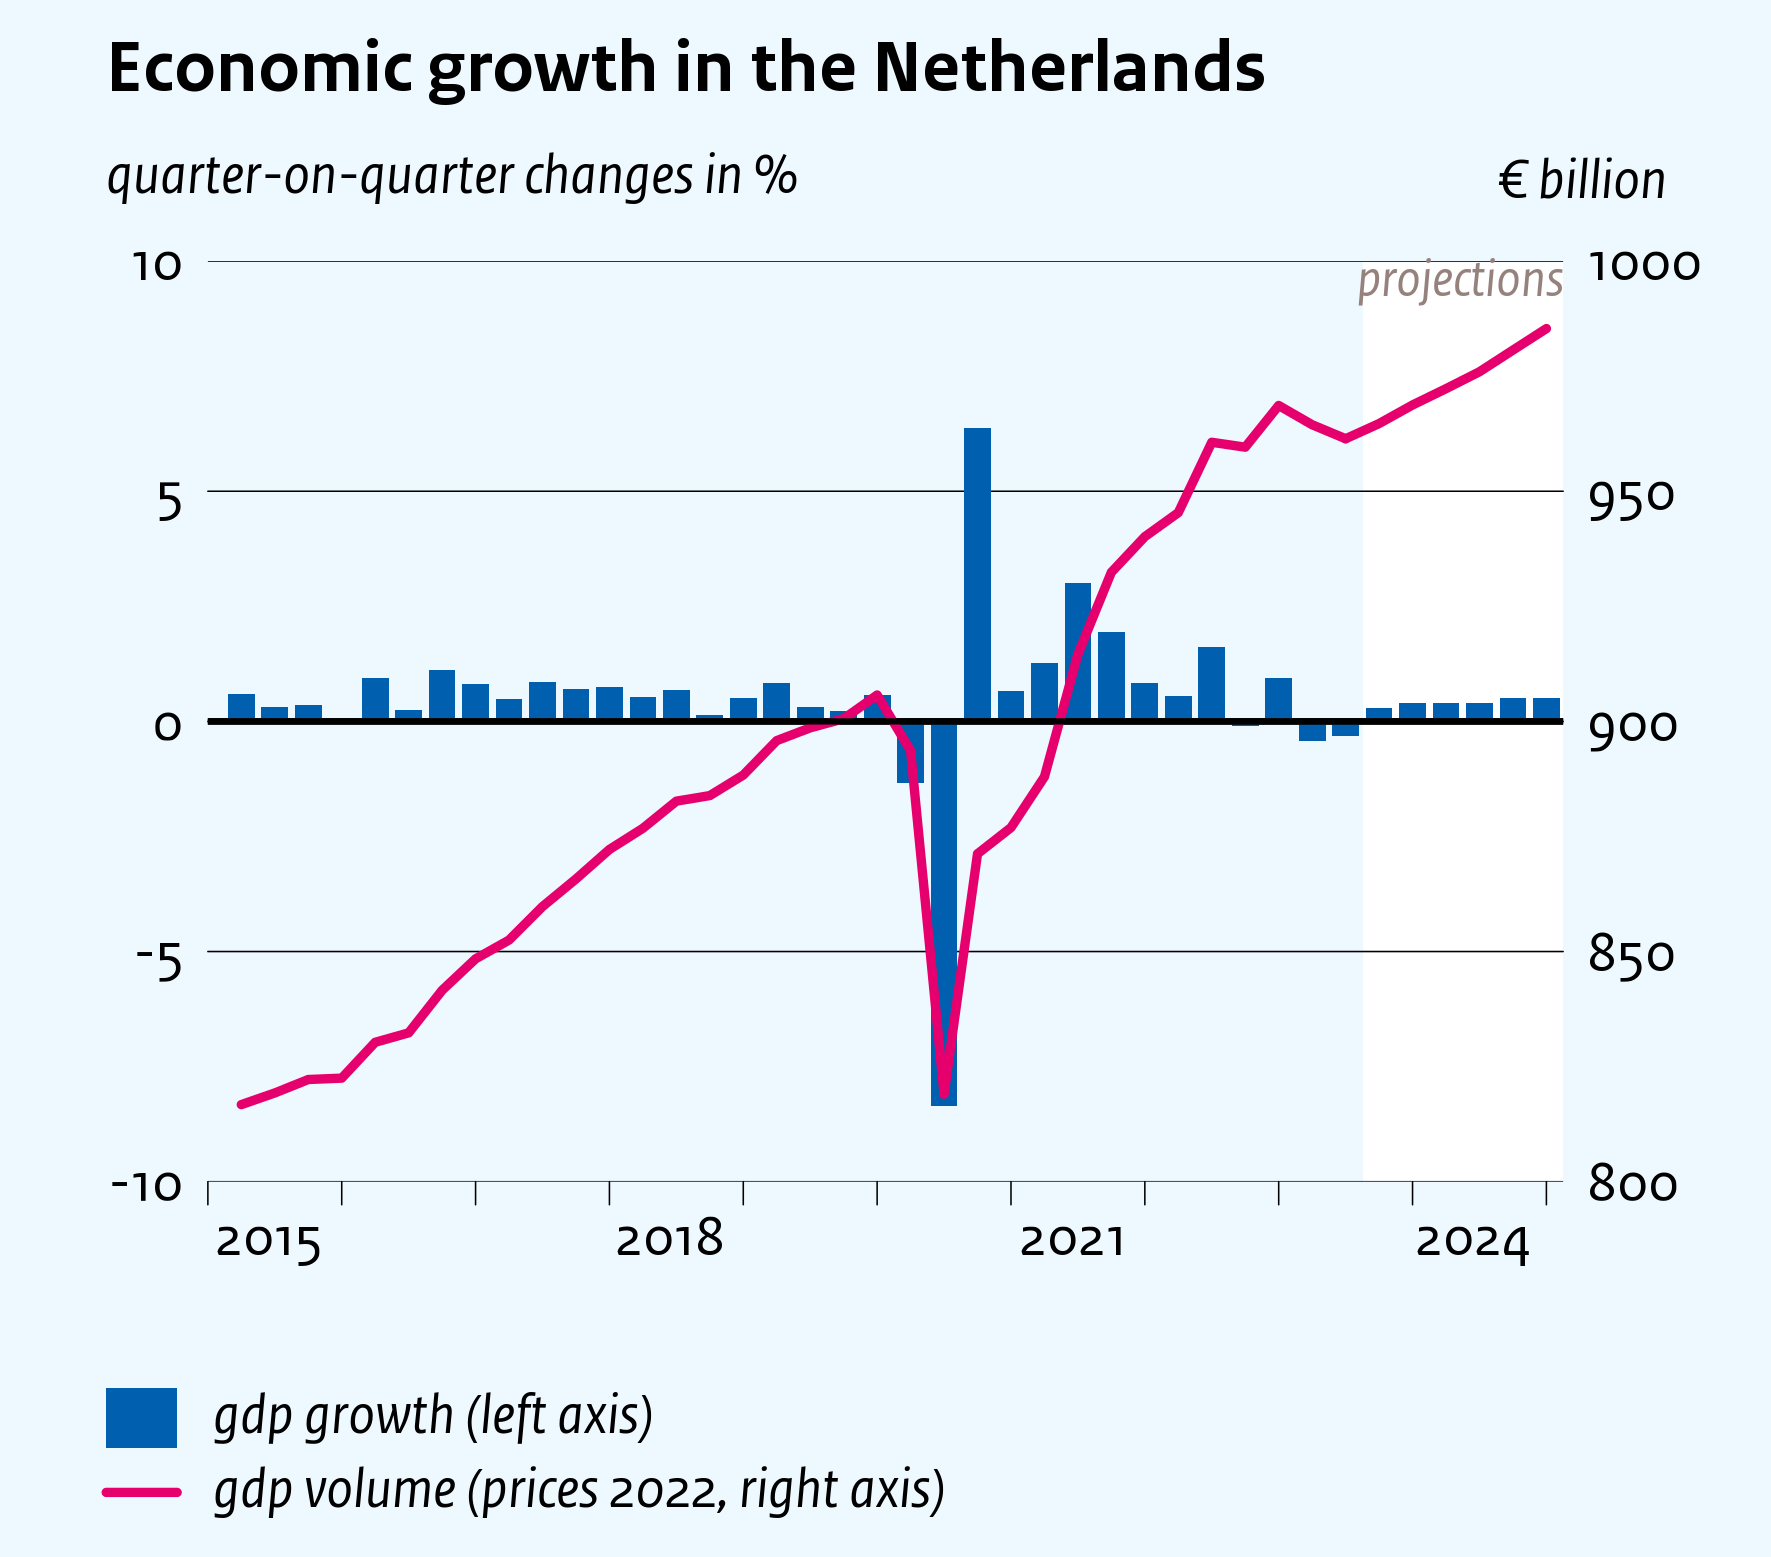
The Dutch economy has withstood a number of major shocks surprisingly well in recent years. The coronavirus crisis, the war in Ukraine and the energy crisis, high inflation and rising interest rates had a major impact on many households and businesses, but the economy as a whole proved resilient. The economy did nevertheless contract slightly in the first quarters of this year, mainly due to declining exports and consumption. Meagre economic growth is expected in 2023 as a whole and in 2024. Inflation is set to remain high for longer than previously expected, at 3.9% in 2023 and 3.8% in 2024.
Purchasing power
Due to persistent high inflation, median purchasing power is expected to fall by 1.1% this year before rising by 1.9% next year. Over the 2022-2024 period, median purchasing power is set to fall by 1.6%. Purchasing power is beginning to recover thanks to the tight labour market, which is causing wages to rise faster than in previous years.
Poverty
The government introduced temporary measures last year to mitigate the impact of higher energy prices, particularly for low-income households. Some of those measures will be discontinued after this year. Without new policy, poverty will rise from 4.8% of the population this year to 5.7% in 2024. In the case of children, the percentage living in poverty will rise from 6.2% to 7.0%.
Public finances
Rising public expenditure on interest, climate policy and health care, as well as in other areas, will lead to a sharp deterioration in public finances over the medium term. If policy remains unchanged, the government deficit will rise from 2.4% of GDP in 2024 to 3.9% of GDP in 2028. Government debt will consequently rise to 54.3% of GDP in 2028.
CPB Director Pieter Hasekamp: “Due to the discontinuation of the temporary purchasing power measures next year, poverty will start to rise again in the Netherlands. If the government wishes to take additional measures to address this, it must fund them in accordance with the current budget rules, because even without additional policy the government deficit is set to rise rapidly in the years ahead.”
| 2023 | 2024 | 2025-2028 | |
| Gross domestic product (GDP, economic growth, % per year) | 0.7 | 1.4 | 1.1 |
| Unemployed rate (% of the labour force) (a) | 3.6 | 4.0 | 4.8 |
| Purchasing power, static, median all households (% per year) (b) | -1.1 | 1.9 | 0.9 |
| People in poverty (level in %) (a,b) | 4.8 | 5.7 | 6.1 |
| General government financial balance (% GDP) (a) | -1.6 | -2.4 | -3.9 |
(a) 2025-2028 is level in last year (2028)
(b) purchasing power and poverty calculated using the alternative CPI, which takes account of the delayed impact of energy prices due to current energy contracts.
Process
This projection forms the basis for the final decisions taken by the government this month for the 2024 national budget, which will be published on Budget Day (September 19). Today, CPB also published a medium-term projection for the period up to the end of 2028, as a basis for calculations in the various electoral programmes.
Only an update of the ‘Main Data’ table accompanying this concept Macro Economic Outlook will be published on September 19. That update will take account of new policy adopted by the government in its decision-making in August.
Contacts

Downloads
")
Table 'Main economic indicators', 2021-2024, August 2023
| 2021 | 2022 | 2023 | 2024 | |
| Relevant world trade volume goods and services (%) | 8.5 | 8.4 | 0.2 | 2.9 |
| Export price competitors (goods and services, non-commodities, %) | 5.9 | 8.8 | 3.4 | 2.5 |
| Crude oil price (dollar per barrel) | 70.7 | 100.8 | 79.3 | 76.3 |
| Exchange rate (dollar per euro) | 1.18 | 1.05 | 1.09 | 1.11 |
| Long-term interest rate the Netherlands (level in %) | -0.3 | 1.4 | 2.8 | 2.8 |
| 2021 | 2022 | 2023 | 2024 | |
| Gross domestic product (GDP, economic growth, %) | 6.2 | 4.3 | 0.7 | 1.4 |
| Household consumption (%) | 4.3 | 6.6 | 0.7 | 2.3 |
| Government consumption (%) | 5.0 | 1.6 | 2.4 | 2.8 |
| Capital formation including changes in stock (%) | 4.7 | 1.0 | 2.6 | 0.1 |
| Exports of goods and services (%) | 8.0 | 4.5 | 0.8 | 1.5 |
| Imports of goods and services (%) | 6.2 | 3.8 | 1.9 | 2.0 |
| 2021 | 2022 | 2023 | 2024 | |
| Price gross domestic product (%) | 2.9 | 5.5 | 6.6 | 3.3 |
| Export price goods and services (%) | 8.8 | 17.4 | 1.0 | 3.4 |
| Import price goods and services (%) | 10.0 | 20.7 | -0.3 | 3.5 |
| Inflation, national consumer price index (CPI, %) | 2.7 | 10.0 | 3.9 | 3.8 |
| Alternative CPI (purchasing power and poverty figures) (%) (a) | 2.1 | 6.8 | 7.8 | 3.6 |
| Inflation, harmonised index of consumer prices (HICP, %) | 2.8 | 11.6 | 4.1 | 3.9 |
| Compensation per hour private sector (%) (b) | 0.0 | 3.7 | 6.8 | 5.8 |
| Wages as determined in collective labour agreements, private sector (%) | 2.2 | 3.1 | 5.8 | 5.6 |
| Purchasing power, static, median all households (%) (c) | 0.9 | -2.7 | -1.1 | 1.9 |
| People in poverty (level in %) (c,d) | 6.1 | 4.7 | 4.8 | 5.7 |
| 2021 | 2022 | 2023 | 2024 | |
| Labour force (%) | 0.9 | 2.4 | 1.9 | 0.9 |
| Active labour force (%) | 1.5 | 3.2 | 1.8 | 0.5 |
| Unemployment (in thousands of persons) | 408 | 350 | 360 | 410 |
| Unemployed rate (% of the labour force) | 4.2 | 3.5 | 3.6 | 4.0 |
| Employment (hours, %) | 3.3 | 3.9 | 1.2 | 0.5 |
| 2021 | 2022 | 2023 | 2024 | |
| Labour share in enterprise income (level in %) | 72.9 | 71.5 | 70.6 | 71.5 |
| Labour productivity private sector (per hour, %) | 4.0 | 1.0 | -0.9 | 0.8 |
| Private savings (% of disposable household income) | 11.2 | 7.6 | 8.2 | 8.8 |
| Current-account balance (level in % GDP) | 12.1 | 9.2 | 9.1 | 8.6 |
| 2021 | 2022 | 2023 | 2024 | |
| General government financial balance (% GDP) | -2.3 | -0.1 | -1.6 | -2.4 |
| Gross debt general government (% GDP) | 51.7 | 50.1 | 48.0 | 47.4 |
| Taxes and social security contributions (% GDP) | 39.2 | 38.6 | 38.7 | 38.3 |
| Gross government expenditure (% GDP) | 46.5 | 43.7 | 44.1 | 44.6 |
(a) The alternative CPI takes into account prices of both new and existing energy contracts. See par. 1.4 of the 'Central Economic Plan-CEP-2023-Verdieping' (link) for more information on the alternative cpi series and see CBS (link).
(b) The NOW wage cost subsidy, and the continuity contribution to health care, have a downward effect of 1.6%-points in 2021 and 2022.
(c) The alternative cpi has been taken into account for the median purchasing power figures and the persons in poverty.
(d) The ratio of the number of persons in households below the poverty line and the total number of persons. The modest-but-adequate budget of the Netherlands Institute for Social Research has been used as the poverty line.
Contacts

