CPBs short-term forecasts December 2015
Stable economic growth in a turbulent world
World trade will increase by 4.3%, although there are large uncertainties about international developments. These are the predictions by CPB Netherlands Bureau for Economic Policy Analysis in their December Projections for 2015 and 2016, published today.
Go straight to the data.
Developments in the world are in motion. The flow of refugees and the threat of terrorism are having a great impact on society. For 2016, however, the economic effects are expected to be limited: population growth will be 0.3% and the government deficit will increase by 0.1%. Strong fluctuations in oil prices and exchange rates as well as on the stock market will have a greater impact on economic growth. The increase in world trade in 2015 has been volatile. For 2016, a moderate growth of 4.3% is projected for relevant world trade.
Consumption is expected to increase next year by over 2%, and savings by households will stabilise. Disposable incomes will increase due to higher wages under low inflation and increased employment, and because of a reduction of 5 billion euros in the financial burden which has been included in these projections. The increase in health care premiums will moderate purchasing power. Investments will increase, as a response to favourable economic developments and increases in profitability. Export levels are growing because of a further lowering of the euro’s exchange rate and the growth in world trade, while natural gas exports are declining. The market sector particularly benefits from a growing demand, with a production increase of 2.7%.
Although employment will increase, the decrease in unemployment will be limited in 2016, as there also will be a strong increase in labour supply. Companies will attract more personnel – and hold on to more people to be able to meet the rising demand. Government employment will see a slight growth, while employment in health care is expected to decline, slightly. Labour supply will increase as a result of demographic factors, policy incentives (including the 5-billion-euro package of measures) and a return to the labour market of the previously discouraged.
The EMU deficit will decrease, from 2.2% in 2015 to 1.8% in 2016, due to economic growth and the spending cuts introduced under the Rutte–Asscher Government Agreement. The reduced revenues from natural gas sales and the reduction in the financial burden through the 5-billion-euro package of measures, together, will dampen the reduction in deficit. The structural deficit will increase from 1.3% of GDP in 2015 to 1.9% in 2016, particularly due to lower revenues from natural gas sales. The government debt is projected to decrease to 65% of GDP.
- Main Conclusions
- Fan Charts
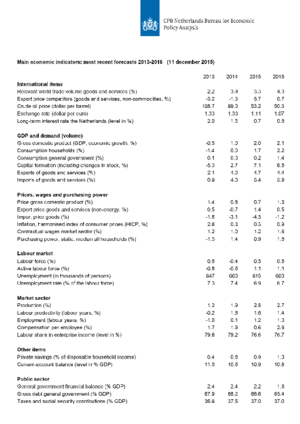
- The table 'Main economic indicators', 2013-2016
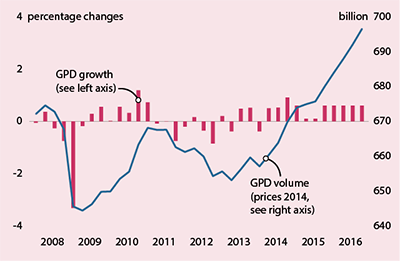
- Graph 'Economic growth in the Netherlands, 2008-2016'
- Related Publications
- Appendix: Main Economic Indicators for the Netherlands, 1970-2016
- Appendix: Key data for the world economy and external data for the Netherlands, 1975-2016
Main conclusions
Read the accompanying press release.
Fan Charts
Take a look at the Fan Charts.
Table 'Main economic indicators', 2013-2016
| 2013 | 2014 | 2015 | 2016 | |
|---|---|---|---|---|
| Relevant world trade volume goods and services (%) |
2.2 |
3.9 |
3.3 |
4.3 |
| Export price competitors (goods and services, non-commodities, %) |
-3.2 |
-1.3 |
5.7 |
0.7 |
| Crude oil price (dollar per barrel) |
108.7 |
99.0 |
53.2 |
50.3 |
| Exchange rate (dollar per euro) |
1.33 |
1.33 |
1.11 |
1.07 |
| Long-term interest rate the Netherlands (level in %) |
2.0 |
1.5 |
0.7 |
0.8 |
| 2013 | 2014 | 2015 | 2016 | |
|---|---|---|---|---|
| Gross domestic product (GDP, economic growth, %) |
-0.5 |
1.0 |
2.0 |
2.1 |
| Consumption households (%) |
-1.4 |
0.0 |
1.7 |
2.2 |
| Consumption general government (%) |
0.1 |
0.3 |
-0.2 |
1.4 |
| Capital formation including changes in stock (%) |
-5.3 |
2.7 |
7.1 |
6.8 |
| Exports of goods and services (%) |
2.1 |
4.0 |
4.7 |
4.4 |
| Imports of goods and services (%) |
0.9 |
4.0 |
5.4 |
5.9 |
| 2013 | 2014 | 2015 | 2016 | |
|---|---|---|---|---|
| Price gross domestic product (%) |
1.4 |
0.8 |
0.7 |
1.3 |
| Export price goods and services (non-energy, %) |
0.5 |
-0.7 |
1.4 |
0.5 |
| Import price goods (%) |
-1.6 |
-3.1 |
-4.5 |
-1.2 |
| Inflation, harmonised index of consumer prices (hicp, %) |
2.6 |
0.3 |
0.3 |
0.9 |
| Contractual wages market sector (%) |
1.2 |
1.0 |
1.2 |
1.6 |
| Purchasing power, static, median all households (%) |
-1.3 |
1.4 |
0.9 |
1.8 |
| 2013 | 2014 | 2015 | 2016 | |
|---|---|---|---|---|
| Labour force (%) |
0.8 |
-0.4 |
0.5 |
0.8 |
| Active labour force (%) |
-0.8 |
-0.6 |
1.1 |
1.1 |
| Unemployment (in thousands of persons) |
647 |
660 |
615 |
600 |
| Unemployed rate (% of the labour force) |
7.3 |
7.4 |
6.9 |
6.7 |
| 2013 | 2014 | 2015 | 2016 | |
|---|---|---|---|---|
| Production (%) |
-1.2 |
1.9 |
2.8 |
2.7 |
| Labour productivity (labour years, %) |
-0.2 |
1.8 |
1.6 |
1.4 |
| Employment (labour years, %) |
-1.0 |
0.1 |
1.2 |
1.3 |
| Compensation per employee (%) |
1.7 |
1.9 |
0.6 |
2.6 |
| Labour share in enterprise income (level in %) |
79.6 |
79.2 |
76.6 |
76.7 |
| 2013 | 2014 | 2015 | 2016 | |
|---|---|---|---|---|
| Private savings (% of disposable household income) |
-0.4 |
0.8 |
0.9 |
1.0 |
| Current-account balance (level in % GDP) |
11.0 |
10.6 |
10.9 |
10.8 |
| 2013 | 2014 | 2015 | 2016 | |
|---|---|---|---|---|
| General government financial balance (% GDP) |
-2.4 |
-2.4 |
-2.2 |
-1.8 |
| Gross debt general government (% GDP) |
67.9 |
68.2 |
66.6 |
65.4 |
| Taxes and social security contributions (% GDP) |
36.6 |
37.5 |
37.0 |
37.0 |
Economic growth in the Netherlands, 2008-2016

Related publications
- CPB Policy Brief 2015/17 "Decemberraming 2015 Economische vooruitzichten 2016" (only in Dutch)"
- CPB Background Document 'The effects of CBS revisions on CPB forecasts'"
Downloads
Contacts

