Central Economic Plan (CEP) 2013
Dutch economic growth weak, due to lagging consumption levels

The download is an English translation of chapter 1 of the Dutch publication.
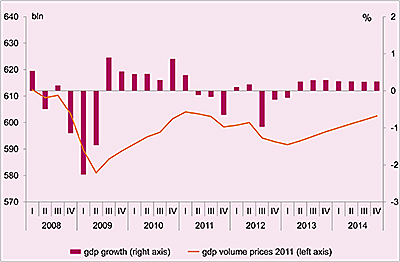
The CEP’s main data were published two weeks ago and have not changed since. CPB projects a budget deficit of 3.3% for 2013 and 3.4% for 2014. Despite a slight recovery later this year, GDP volume is projected to decline in 2013 by ½%. For 2014, an economic growth of 1% is projected. Unemployment in 2013 will increase by 90,000 people to a total of 560,000 and in 2014 to 575,000.
Private consumption levels are expected to decline in 2013 by 1½% due to lower wage and benefit incomes and lower house prices. Real house prices have declined by 23% since 2008, and even when lower incomes and house prices are taken into account, the growth in consumption has been lagging behind since 2009. One of the possible explanations for this fact is that, since 2008, Dutch consumer confidence has declined strongly. For 2014, consumption levels are projected to increase slightly (1/4%) because of a small improvement in disposable income.
Related:
Read the accompanying press release.
The download is an English translation of chapter 1 of the complete Dutch publication.
Related
The 'Centraal Economisch Plan 2013', ISBN 978-90-1257-777-9 (only in Dutch), can be ordered from March 23, 2013 at:
Sdu Service Centre Publishers (www.sdu.nl)
P.O. Box 20014
2500 EA The Hague
The Netherlands
Telephone : +31-70-3789880
Price: 35 euro
Downloads
Tekortreducerende maatregelen 2011-2017
We are sorry, unfortunately there is no English translation of this page
Authors
Presentatie Centraal Economisch Plan 2013
We are sorry, unfortunately there is no English translation of this page.
CPBs short-term forecasts March 2013
- Main Conclusions
- The table 'Extended main economic indicators', 2011-2014
- Graph 'Economic growth in the Netherlands, 2008-2014'
- Related Publication
- Appendix: Main Economic Indicators for the Netherlands, 1970-2014
- Appendix: Main indicators labour market (E7), 1969-2014
Main conclusions
Read the accompanying press release.
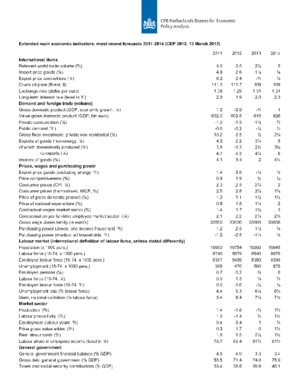
Table 'Extended main economic indicators', 2011-2014
| 2011 | 2012 | 2013 | 2014 | |
|---|---|---|---|---|
| Relevant world trade (vol. %) | 4.0 | 0.5 | 2 3/4 | 5 |
| Import price goods (%) | 4.9 | 2.6 | -1 1/4 | 3/4 |
| Export price competitors (%) | 6.3 | 2.4 | -1/2 | 3/4 |
| Crude oil price (Brent, $) | 111.3 | 111.7 | 109 | 109 |
| Exchange rate (dollar p euro) | 1.39 | 1.29 | 1.31 | 1.31 |
| Long-term interest rate (level in %) | 2.9 | 1.9 | 2.0 | 2.3 |
| 2011 | 2012 | 2013 | 2014 | |
|---|---|---|---|---|
| Gross domestic product (GDP, economic growth) (%) | 1.0 | -0.9 | -1/2 | 1 |
| Value gross domestic product (GDP) (bln euro) | 602.0 | 602.8 | 610 | 626 |
| Private consumption (%) | -1.0 | -1.5 | -1 1/2 | 1/4 |
| Public demand (%) | -0.6 | -0.2 | -1/4 | 1/2 |
| Gross fixed investment, private non-residential (%) | 10.2 | -2.5 | 1/2 | 2 1/4 |
| Exports of goods (non-energy) (%) | 4.3 | 2.2 | 3 1/4 | 5 |
| of which domestically produced (%) | 3.8 | -0.3 | 2 1/2 | 3 3/4 |
| re-exports (%) | 4.7 | 4.5 | 4 1/4 | 6 |
| Imports of goods (%) | 4.1 | 3.4 | 2 | 4 1/2 |
| 2011 | 2012 | 2013 | 2014 | |
|---|---|---|---|---|
| Export price goods (excluding energy) (%) | 1.4 | 0.6 | -3/4 | 3/4 |
| Price competitiveness (%) | 0.9 | 1.9 | 1/2 | 1/4 |
| Consumer prices (CPI) (%) | 2.3 | 2.5 | 2 3/4 | 2 |
| Consumer prices (harmonised, HICP) (%) | 2.5 | 2.8 | 2 3/4 | 1 3/4 |
| Price of gross domestic product (%) | 1.2 | 1.1 | 1 1/2 | 1 1/2 |
| Price of national expenditure (%) | 0.8 | 1.8 | 1 3/4 | 2 |
| Contractual wages market sector (%) | 1.4 | 1.7 | 1 3/4 | 2 |
| Compensation per full-time employee market sector (%) | 2.1 | 2.2 | 2 1/4 | 2 3/4 |
| Gross wage Jones family (in euro's) | 33500 | 33000 | 33000 | 33500 |
| Purchasing power (Jones, one-income household) (%) | -1.2 | -2.5 | -1 1/2 | -3/4 |
| Purchasing power (median, all households) (%) | -1.0 | -2.5 | -1 1/4 | 3/4 |
| 2011 | 2012 | 2013 | 2014 | |
|---|---|---|---|---|
| Population (x 1000 pers.) | 16693 | 16754 | 16800 | 16845 |
| Labour force (15-74) (x 1000 pers.) | 8746 | 8879 | 8940 | 8970 |
| Employed labour force (15-74) (x 1000 pers.) | 8357 | 8409 | 8380 | 8395 |
| Unemployment (x 1000 pers.) | 389 | 470 | 560 | 575 |
| Employed Persons (15-74) (%) | 0.7 | -0.2 | -1/2 | 0 |
| Labour force (15-74) (%) | 0.0 | 1.5 | 3/4 | 1/4 |
| Employed labour force (15-74) (%) | 0.0 | 0.6 | -1/4 | 1/4 |
| Unemployment rate (% labour force) | 4.4 | 5.3 | 6 1/4 | 6 1/2 |
| Idem, national definition (% labour force) | 5.4 | 6.4 | 7 3/4 | 7 3/4 |
| 2011 | 2012 | 2013 | 2014 | |
|---|---|---|---|---|
| Production (%) | 1.4 | -1.8 | -1/2 | 1 1/4 |
| Labour productivity (%) | 1.0 | -1.4 | 1/2 | 1 1/2 |
| Employment (labour years) (%) | 0.4 | -0.4 | -1 | -1/4 |
| Price gross value added (%) | 0.3 | 1.7 | 0 | 1 1/4 |
| Real labour costs (%) | 1.8 | 0.5 | 2 1/4 | 1 1/2 |
| Labour share in enterprise income (level in %) | 78.7 | 80.4 | 81 1/2 | 81 1/4 |
| 2011 | 2012 | 2013 | 2014 | |
|---|---|---|---|---|
| General government financial balance (% GDP) | -4.5 | -4.0 | -3.3 | -3.4 |
| Gross debt general government (% GDP) | 65.5 | 71.4 | 74.0 | 75.0 |
| Taxes and social security contributions (% GDP) | 38.4 | 38.8 | 39.9 | 40.1 |
Economic growth in the Netherlands, 2008-2014


