Markups van bedrijven in Nederland

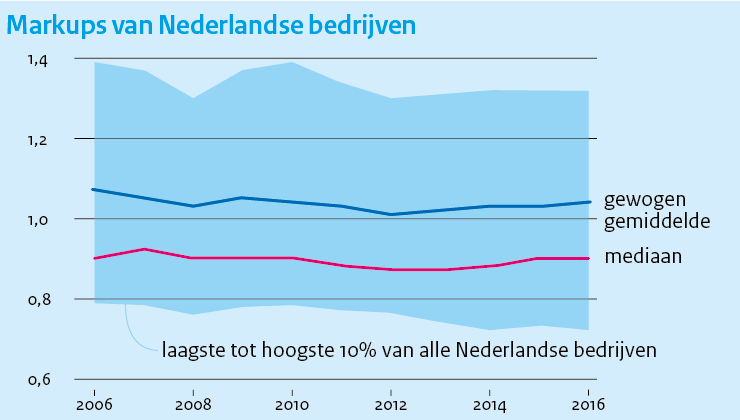
Wij vinden voor Nederland dat de meeste sectoren geen stijgende markups laten zien in de periode 2006-2015 op basis van NFO data. Het gewogen gemiddelde van de markups in Nederland kent hierdoor een nagenoeg vlakke ontwikkeling. Voor beursgenoteerde multinationals met geconsolideerde balansen vinden wij, als we voor uitschieters corrigeren, licht stijgende markups na 2012, op basis van WorldScope data.
Samen met het feit dat er in Europa minder superstar firms zijn, lijkt dit er op te wijzen dat de ontwikkeling van toenemende marktmacht van een klein aantal bedrijven, die in de VS gaande is, niet voor Nederland geldt. De verklaring die in de internationale literatuur wordt gegeven voor vertraagde productiviteitsgroei, namelijk stijgende markups die wijzen op toegenomen marktmacht van een klein aantal superstar firms en daardoor afnemende competitie, geldt dus niet voor Nederland.
This research is part of a series of papers in which the productivity slowdown and its possible causes for the Netherlands are analysed. A previous study (Grabska et al., 2017) finds that, as in many OECD countries, productivity growth in the Netherlands is slowing down. Subsequently, we analyse the dynamics of firms on the productivity frontier and laggard firms (See van Heuvelen et al., 2018 and Meijerink et al., 2018). We find no indication of divergence taking place between the most productive firms (frontier firms) and less productive firms (laggards) in terms of productivity over time.
Downloads
In this report our attention turns to markups. An expanding body of studies estimates firm-level markups, defined as the ratio of output price over its marginal cost. Although the timing of the increase differs, most studies report a sharp increase in the average markup in the US and Europe (including the Netherlands), which is driven by firms located at the top of the markup distribution (i.e. De Loecker and Eeckhout, 2017, 2018; Calligaris et al., 2018; Diez et al., 2018). Since this increase is interpreted as an indication of the lack of competition between firms, it has sparked a discussion on the possible need for policy intervention. Furthermore, the increase in markup is associated with a number of other trends, like the fall in the labour income share (De Loecker and Eeckhout, 2017; Autor et al., 2017b), underinvestment (Gutiérrez and Philippon, 2017a) and the growing share of intangibles (Haskel and Westlake, 2017).
The recent slowdown in productivity in the US has been linked to decreasing competition (De Loecker and Eeckhout, 2017), which may also apply to the Netherlands. Therefore, this paper assesses changes in the competitive environment of firms in the Netherlands, measured by changes in the markup. Most studies focus on a sample of very large firms (i.e. publicly traded firms). Smaller, often private firms are usually excluded due to data limitations. We use a large representative firm-level dataset to explore the development of markups in the years 2006-2016. Unlike other studies, we are able to study the development of markups of smaller firms. We closely follow the production function approach proposed by De Loecker and Warzynski (2012). This approach derives firm-level markups from the first-order condition that determines the cost minimizing level of a flexible input.
We derive the following main results. First, we show that the average (weighted) markup in the Netherlands has not risen over 11 years. We do find some evidence that markups are mainly increased by firms located at the upper end of the markup distribution. However, this increase is far below the magnitude found in other papers and is not driven by large firms. Second, average markups are estimated to be higher in service sectors than in manufacturing sectors. In addition, the dispersion is greater within service sectors, indicating greater markup heterogeneity between firms. Third, we find that large and small firms within a sector produce differently. The separate estimation of markups for each size group leads to higher (lower) markup levels for larger (smaller) firms. Finally, we use different setups to check the sensitivity of our results to methodological choices. We find that the main results are robust.
The rest of the paper is organized as follows. The next section discusses the relevant literature. Section 3 discusses the data and the construction of the variables. Section 4 describes the applied methodology. Finally 5 provides empirical results and discusses the implications.
Authors


Authors


