Projections September 2023 (MEV 2024)
Purchasing power measures prevent rise in poverty, government deficit remains unchanged

The increase in the child budget, the rent allowance, labour tax credit and social welfare benefits prevent a rise in poverty in 2024. A total of 830,000 people are projected to be below the poverty line in 2024 (4.8% of the population). In the draft Macro Economic Outlook (cMEV), published in August, CPB projected a total of 990,000 (5.7% of the population). Poverty among children falls as a result of the new measures from 6.2% in 2023 to 5.1% in 2024. In the cMEV this percentage was projected to be 7.0%. Child poverty decreases because the increase in the child budget only benefits households with children.
Purchasing power
The purchasing power package improves the purchasing power of the lowest two income groups (households with gross income of up to 47,000 euros) compared to the cMEV. At the same time the financial burden is increased in order to meet the budgetary cost of the measures. This increase in the financial burden mainly affects people on higher incomes, causing their purchasing power to rise less than was previously projected. The increase in median purchasing power therefore remains almost unchanged overall in 2024 compared to the cMEV (1.8%) and the differences between the income groups are smaller.
Public finances and GDP growth
The government deficit remains unchanged compared to the previous projection, because the additional expenditure is funded by increases in the financial burden. The government deficit is 2.4% of gross domestic product in 2024, the same as in the cMEV. Economic growth is expected to be 1.5% in 2024, 0.1% higher than projected in the cMEV.
| 2023 | 2024 | Difference in 2024 compared to cMEV | |
| Gross domestic product (GDP, economic growth, % per year) | 0.7 | 1.5 | 0.1 |
| Unemployed rate (% of the labour force) | 3.6 | 4.0 | 0.0 |
| Purchasing power, static, median all households (% per year) (a) | -1.1 | 1.8 | -0.1 |
| People in poverty (level in %) (a) | 4.8 | 4.8 | -0.9 |
| General government deficit (% GDP) | 1.6 | 2.4 | 0.0 |
(a) purchasing power and poverty calculated using the alternative CPI, which from 2021 takes account of the delayed impact of energy prices due to current energy contracts.
The most recent version of the Excel-appendices with long series can be found in the cMEV 2024-projections, published in August.
Downloads
In totaal zijn zeventien fiscale maatregelen aan een uitvoerige toetsing onderworpen. Daarvan zijn er vijftien beoordeeld vanwege een geraamd budgettair effect van tenminste 50 mln euro, grote gedragseffecten of een sterk onzekere grondslag en twee op basis van een steekproef.
Authors


Voor de bekostiging van uitkeringen op grond van de Participatiewet ontvangen gemeenten een budget van het ministerie van Sociale Zaken Werkgelegenheid. De hoogte van het budget wordt bepaald op basis van een raming voor het aantal uitkeringsgerechtigden en de gemiddelde hoogte van een bijstandsuitkering. Het CPB publiceert ramingen van het aantal bijstandsuitkeringen in het lopende en komende jaar in het Centraal Economisch Plan (CEP) in maart en in de MEV in september.
Authors


The most recent version of the Excel-appendices with long series can be found in the cMEV 2024-projections, published in August.
Downloads
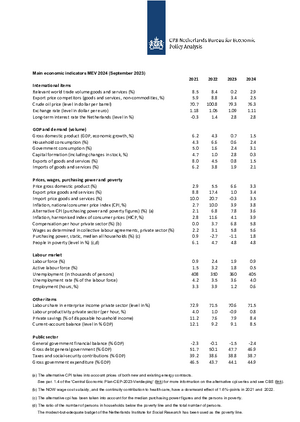
Table 'Main economic indicators', 2021-2024, September 2023
| 2021 | 2022 | 2023 | 2024 | |
| Relevant world trade volume goods and services (%) | 8.5 | 8.4 | 0.2 | 2.9 |
| Export price competitors (goods and services, non-commodities, %) | 5.9 | 8.8 | 3.4 | 2.5 |
| Crude oil price (dollar per barrel) | 70.7 | 100.8 | 79.3 | 76.3 |
| Exchange rate (dollar per euro) | 1.18 | 1.05 | 1.09 | 1.11 |
| Long-term interest rate the Netherlands (level in %) | -0.3 | 1.4 | 2.8 | 2.8 |
| 2021 | 2022 | 2023 | 2024 | |
| Gross domestic product (GDP, economic growth, %) | 6.2 | 4.3 | 0.7 | 1.5 |
| Household consumption (%) | 4.3 | 6.6 | 0.6 | 2.4 |
| Government consumption (%) | 5.0 | 1.6 | 2.4 | 3.1 |
| Capital formation including changes in stock (%) | 4.7 | 1.0 | 2.8 | 0.3 |
| Exports of goods and services (%) | 8.0 | 4.5 | 0.8 | 1.5 |
| Imports of goods and services (%) | 6.2 | 3.8 | 1.9 | 2.1 |
| 2021 | 2022 | 2023 | 2024 | |
| Price gross domestic product (%) | 2.9 | 5.5 | 6.6 | 3.3 |
| Export price goods and services (%) | 8.8 | 17.4 | 1.0 | 3.4 |
| Import price goods and services (%) | 10.0 | 20.7 | -0.3 | 3.5 |
| Inflation, national consumer price index (CPI, %) | 2.7 | 10.0 | 3.9 | 3.8 |
| Alternative CPI (purchasing power and poverty figures) (%) (a) | 2.1 | 6.8 | 7.8 | 3.6 |
| Inflation, harmonised index of consumer prices (HICP, %) | 2.8 | 11.6 | 4.1 | 3.9 |
| Compensation per hour private sector (%) (b) | 0.0 | 3.7 | 6.8 | 5.8 |
| Wages as determined in collective labour agreements, private sector (%) | 2.2 | 3.1 | 5.8 | 5.6 |
| Purchasing power, static, median all households (%) (c) | 0.9 | -2.7 | -1.1 | 1.8 |
| People in poverty (level in %) (c,d) | 6.1 | 4.7 | 4.8 | 4.8 |
| 2021 | 2022 | 2023 | 2024 | |
| Labour force (%) | 0.9 | 2.4 | 1.9 | 0.9 |
| Active labour force (%) | 1.5 | 3.2 | 1.8 | 0.5 |
| Unemployment (in thousands of persons) | 408 | 350 | 360 | 405 |
| Unemployed rate (% of the labour force) | 4.2 | 3.5 | 3.6 | 4.0 |
| Employment (hours, %) | 3.3 | 3.9 | 1.2 | 0.6 |
| 2021 | 2022 | 2023 | 2024 | |
| Labour share in enterprise income (level in %) | 72.9 | 71.5 | 70.6 | 71.5 |
| Labour productivity private sector (per hour, %) | 4.0 | 1.0 | -0.9 | 0.8 |
| Private savings (% of disposable household income) | 11.2 | 7.6 | 7.9 | 8.4 |
| Current-account balance (level in % GDP) | 12.1 | 9.2 | 9.1 | 8.5 |
| 2021 | 2022 | 2023 | 2024 | |
| General government financial balance (% GDP) | -2.3 | -0.1 | -1.5 | -2.4 |
| Gross debt general government (% GDP) | 51.7 | 50.1 | 47.7 | 46.9 |
| Taxes and social security contributions (% GDP) | 39.2 | 38.6 | 38.8 | 38.7 |
| Gross government expenditure (% GDP) | 46.5 | 43.7 | 44.1 | 44.9 |
(a) The alternative CPI takes into account prices of both new and existing energy contracts. See par. 1.4 of the 'Central Economic Plan-CEP-2023-Verdieping' (link) for more information on the alternative cpi series and see CBS (link).
(b) The NOW wage cost subsidy, and the continuity contribution to health care, have a downward effect of 1.6%-points in 2021 and 2022.
(c) The alternative cpi has been taken into account for the median purchasing power figures and the persons in poverty.
(d) The ratio of the number of persons in households below the poverty line and the total number of persons. The modest-but-adequate budget of the Netherlands Institute for Social Research has been used as the poverty line.
Contacts


