Preliminary Forecast March 2019 (cCEP 2019)
The economy is cooling

| Main data for the Dutch economy | 2018 | 2019 | 2020 |
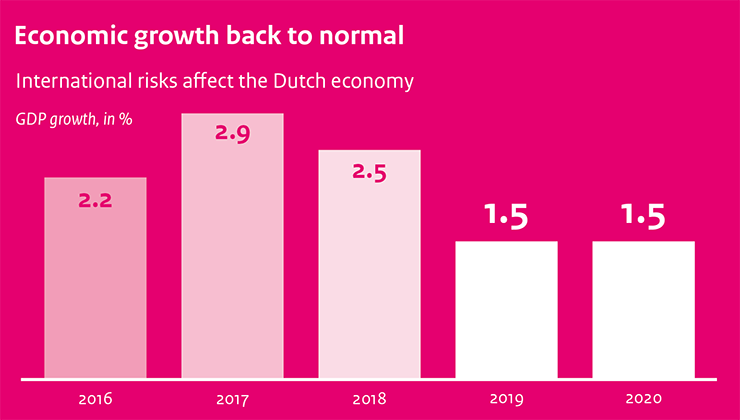
| GDP growth back to normal | 2.5 | 1.5 | 1.5 |
| Unemployment remains low | 3.8 | 3.8 | 4.0 |
| Higher inflation in 2019, due to higher VAT and energy taxes | 1.6 | 2.3 | 1.4 |
| Policy and higher wages are stimulating purchasing power | 0.3 | 1.6 | 1.3 |
| Budget surplus | 1.4 | 1.2 | 0.8 |
| Government debt continues to decrease | 52.4 | 49.1 | 47.1 |
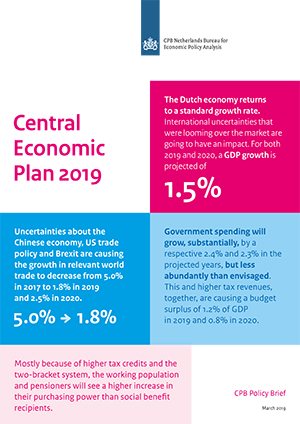
Government spending will increase substantially, although less so than envisaged. Higher expenditures will contribute to the economic growth projected for 2019 and 2020. And yet, some planned increases in spending, particularly regarding defence and infrastructure, will not be realised, partly because of the tight labour market. This contributes to a larger budget surplus projected for both years.
In addition to the newest economic figures, CPB also points to the benefits of a stable budget policy in case of further economic decline. Lower educated people and those working in flexible employment relationships would be hit the hardest by such a decline. Structural reforms could limit the uncertainties for such vulnerable groups in society.
The full report, the Central Economic Plan 2019, is to be published (in Dutch) on 21 March. It will include the same figures as those presented today.

Downloads
Vragen en antwoorden
Zijn de meest actuele energieprijzen in de koopkrachtcijfers meegenomen?
Ja, de meest actuele inzichten zijn in de raming meegenomen. Het CPB neemt de energieprijzen mee via de raming voor de inflatie. De laatste cijfers van het CBS over januari (inclusief het effect van de hogere btw en energierekening) zijn hierin verwerkt.
Wat is het effect van de hogere energieprijzen (en de btw-verhoging) op de inflatie?
De lastenverhoging ging in per 1 januari en werkt naar verwachting snel door in prijzen. Het inflatiecijfer (CPI) kwam januari jl. uit op 2,2%, wat in lijn is met de huidige CPB-raming van 2,3% voor 2019. De raming dat 96% van alle huishoudens er in 2019 in koopkracht op vooruit gaan, is gebaseerd op dit laatste cijfer (2,3% inflatie).
Hoe zijn de energielasten in de koopkracht verwerkt?
De energielasten zijn onderdeel van het officiële inflatiecijfer. Het CPB hanteert de CBS-definities van besteedbaar inkomen, consumptie en inflatie. De koopkrachtontwikkeling geeft de verandering van het besteedbaar inkomen weer. Daarbij wordt rekening gehouden met de algemene prijsstijging van de goederen en diensten die Nederlandse huishoudens consumeren.
Het CPB publiceert soms aanvullende analyses in aanvulling op de reguliere ramingen. Zo is in de vorige editie van het CEP (voorjaar 2018) gekeken naar de effecten van het klimaatbeleid op verschillende inkomensgroepen.
Hoe zeker is de raming?
Een raming is altijd omgeven door onzekerheid. Zo kunnen de lonen sneller of juist minder snel stijgen, wat onder andere weer gevolgen heeft voor de koopkrachtontwikkeling. Belangrijke onzekerheden rond de raming komen voort uit de internationale politieke en economische omgeving, zoals de Chinese economie, de Brexit en het handelsbeleid van de VS.
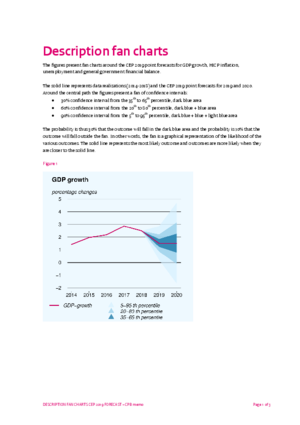
Fan Charts March 2019 (cCEP)
The figures present fan charts around the CEP 2019 point forecasts for GDP growth, HICP inflation, unemployment and general government financial balance.
The figures present fan charts around the CEP 2019 point forecasts for GDP growth, HICP inflation, unemployment and general government financial balance.The solid line represents data realizations (2014-2018) and the CEP 2019 point forecasts for 2019 and 2020. Around the central path the figures present a fan of confidence intervals:
Downloads
Contacts


Downloads
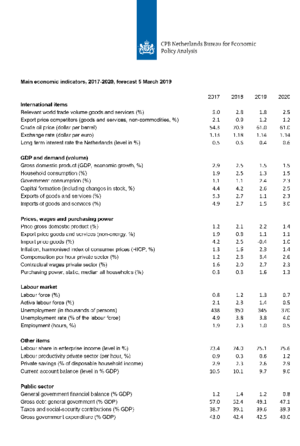
Table 'Main economic indicators', 2017-2020, 5 March 2019
| 2017 | 2018 | 2019 | 2020 | |
| Relevant world trade volume goods and services (%) | 5.0 | 2.8 | 1.8 | 2.5 |
| Export price competitors (goods and services, non-commodities, %) | 2.1 | 0.9 | 1.2 | 1.2 |
| Crude oil price (dollar per barrel) | 54.3 | 70.9 | 61.0 | 61.0 |
| Exchange rate (dollar per euro) | 1.13 | 1.18 | 1.14 | 1.14 |
| Long-term interest rate the Netherlands (level in %) | 0.5 | 0.6 | 0.4 | 0.6 |
| 2017 | 2018 | 2019 | 2020 | |
| Gross domestic product (GDP, economic growth, %) | 2.9 | 2.5 | 1.5 | 1.5 |
| Consumption households (%) | 1.9 | 2.5 | 1.3 | 1.5 |
| Consumption general government (%) | 1.1 | 1.1 | 2.4 | 2.3 |
| Capital formation including changes in stock (%) | 4.4 | 4.2 | 2.6 | 2.5 |
| Exports of goods and services (%) | 5.3 | 2.7 | 1.1 | 2.3 |
| Imports of goods and services (%) | 4.9 | 2.7 | 1.5 | 3.0 |
| 2017 | 2018 | 2019 | 2020 | |
| Price gross domestic product (%) | 1.2 | 2.1 | 2.2 | 1.4 |
| Export price goods and services (non-energy, %) | 1.9 | 0.8 | 1.1 | 1.1 |
| Import price goods (%) | 4.2 | 2.5 | -0.4 | 1.0 |
| Inflation, harmonised index of consumer prices (hicp, %) | 1.3 | 1.6 | 2.3 | 1.4 |
| Compensation per hour private sector (%) | 1.2 | 2.3 | 3.4 | 2.6 |
| Contractual wages private sector (%) | 1.6 | 2.0 | 2.7 | 2.3 |
| Purchasing power, static, median, all households (%) | 0.3 | 0.3 | 1.6 | 1.3 |
| 2017 | 2018 | 2019 | 2020 | |
| Labour force (%) | 0.8 | 1.2 | 1.3 | 0.7 |
| Active labour force (%) | 2.1 | 2.3 | 1.4 | 0.5 |
| Unemployment (in thousands of persons) | 438 | 350 | 345 | 370 |
| Unemployed rate (% of the labour force) | 4.9 | 3.8 | 3.8 | 4.0 |
| Employment (hours, %) | 1.9 | 2.3 | 1.0 | 0.5 |
| 2017 | 2018 | 2019 | 2020 | |
| Labour share in enterprise income (level in %) | 73.4 | 74.0 | 75.1 | 75.6 |
| Labour productivity private sector (per hour, %) | 0.9 | 0.3 | 0.6 | 1.2 |
| Private savings (% of disposable household income) | 2.9 | 2.3 | 2.6 | 2.9 |
| Current-account balance (level in % GDP) | 10.5 | 10.1 | 9.7 | 9.0 |
| 2017 | 2018 | 2019 | 2020 | |
| General government financial balance (% GDP) | 1.2 | 1.4 | 1.2 | 0.8 |
| Gross debt general government (% GDP) | 57.0 | 52.4 | 49.1 | 47.1 |
| Taxes and social security contributions (% GDP) | 38.7 | 39.1 | 39.6 | 39.3 |
| Gross government expenditure (% GDP) | 43.0 | 42.4 | 42.5 | 43.0 |


