June forecast 2020
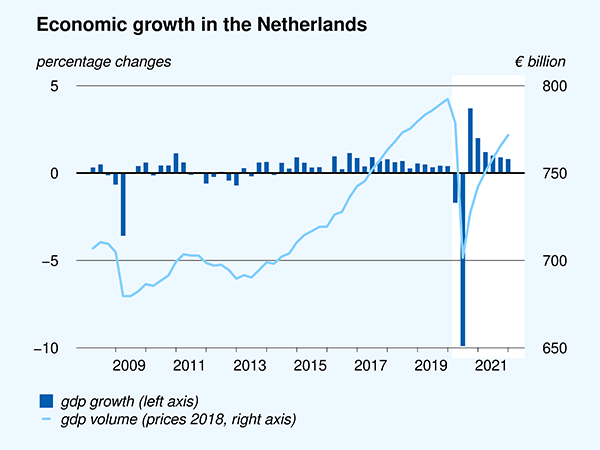
Unprecedented 6% decrease in GDP in 2020, amid great uncertainty

| Baseline scenario projections: | 2019 | 2020 | 2021 |
| Unprecedented decrease in GDP, followed by partial recovery | 1.8 | -6 | 3 |
| Rapid increase in unemployment | 3.4 | 5 | 7 |
| Large budget deficit | 1.7 | -8 | -5 |
| Debt stabilises at a substantially higher level (% of GDP) | 48.7 | 62 | 61 |
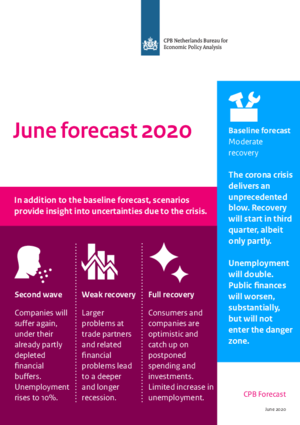
If a second wave of infections would lead to renewed social distancing measures, companies will face additional production problems as well as a further decline in the demand for their products and services, with financial buffers already close to depletion. Under this scenario, GDP would decrease also in 2021, with unemployment rising to 10% and public debt increasing to over 75% of GDP.
The pace of recovery could be less favourable due to major economic problems on the side of trading partners of the Netherlands. In case of lagging economic recovery on an international level, banks may find themselves in trouble, both in the Netherlands and abroad. This would further dampen the recovery via credit provisioning. Under such a scenario of weak economic recovery, there would be no growth in GDP in 2021, with unemployment rising to more than 10% and public debt increasing to over 75% of GDP.
It is also conceivable that economic recovery will occur more rapidly, if lifting social distancing restrictions would lead consumer optimism. Increased catch-up spending among households and increases in business investments to capitalise on new opportunities, could limit the increase in unemployment. Under such a scenario of strong recovery, by 2021, GDP may increase beyond the 2019 level.
Downloads
.


Downloads
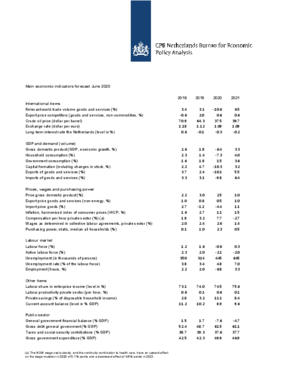
Table 'Main economic indicators', 2018-2021, June 2020
| 2018 | 2019 | 2020 | 2021 | |
| Relevant world trade volume goods and services (%) | 3.4 | 3.1 | -10.6 | 6.5 |
| Export price competitors (goods and services, non-commodities, %) | -0.6 | 2.0 | 0.6 | 0.6 |
| Crude oil price (dollar per barrel) | 70.9 | 64.3 | 37.5 | 39.7 |
| Exchange rate (dollar per euro) | 1.18 | 1.12 | 1.09 | 1.09 |
| Long-term interest rate the Netherlands (level in %) | 0.6 | -0.1 | -0.3 | -0.2 |
| 2018 | 2019 | 2020 | 2021 | |
| Gross domestic product (GDP, economic growth, %) | 2.6 | 1.8 | -6.4 | 3.3 |
| Household consumption (%) | 2.3 | 1.4 | -7.3 | 4.0 |
| Government consumption (%) | 1.6 | 1.8 | 1.5 | 3.6 |
| Capital formation including changes in stock (%) | 2.2 | 4.7 | -10.3 | 3.2 |
| Exports of goods and services (%) | 3.7 | 2.4 | -10.1 | 5.5 |
| Imports of goods and services (%) | 3.3 | 3.1 | -9.8 | 6.4 |
| 2018 | 2019 | 2020 | 2021 | |
| Price gross domestic product (%) | 2.2 | 3.0 | 2.5 | 1.0 |
| Export price goods and services (non-energy, %) | 1.0 | 0.8 | 0.5 | 1.0 |
| Import price goods (%) | 2.7 | -1.2 | -4.4 | 1.1 |
| Inflation, harmonised index of consumer prices (HICP, %) | 1.6 | 2.7 | 1.1 | 1.5 |
| Compensation per hour private sector (%) (a) | 1.8 | 3.2 | 7.7 | -2.7 |
| Wages as determined in collective labour agreements, private sector (%) | 2.0 | 2.4 | 2.6 | 1.4 |
| Purchasing power, static, median all households (%) | 0.1 | 1.0 | 2.3 | 0.5 |
| 2018 | 2019 | 2020 | 2021 | |
| Labour force (%) | 1.2 | 1.6 | -0.6 | 0.3 |
| Active labour force (%) | 2.3 | 2.0 | -2.1 | -2.0 |
| Unemployment (in thousands of persons) | 350 | 314 | 445 | 645 |
| Unemployed rate (% of the labour force) | 3.8 | 3.4 | 4.8 | 7.0 |
| Employment (hours, %) | 2.2 | 2.0 | -6.8 | 3.3 |
| 2018 | 2019 | 2020 | 2021 | |
| Labour share in enterprise income (level in %) | 73.1 | 74.0 | 74.5 | 75.6 |
| Labour productivity private sector (per hour, %) | 0.6 | 0.1 | 0.6 | 0.1 |
| Private savings (% of disposable household income) | 2.8 | 3.2 | 11.1 | 8.4 |
| Current-account balance (level in % GDP) | 11.2 | 10.2 | 8.9 | 9.6 |
| 2018 | 2019 | 2020 | 2021 | |
| General government financial balance (% GDP) | 1.5 | 1.7 | -7.6 | -4.7 |
| Gross debt general government (% GDP) | 52.4 | 48.7 | 61.5 | 61.1 |
| Taxes and social security contributions (% GDP) | 38.7 | 39.3 | 37.6 | 37.7 |
| Gross government expenditure (% GDP) | 42.5 | 42.3 | 49.9 | 46.9 |
(a) The NOW wage cost subsidy, and the continuity contribution to health care, have an upward effect on the wage mutation in 2020 of 5.7%-points and a downward effect of 4.6%-points in 2021.
Contacts

Contacts


