
CPB's short-term forecasts June 2015
Recovery Dutch economy continues
Unemployment will decrease to 7.0% this year and 6.7% in 2016. The EMU deficit is expected to come to 0.8% in 2016. This according to CPB Netherlands Bureau for Policy Analysis in its June projections, published today. The publication can be accessed via this [link].
For the Dutch economy for this year and the next, a respective increase of 2.0% and 2.1% is projected. All spending categories will contribute to this recovery. Relevant world trade will grow by 4.0% in 2015 and 5.2% in 2016. This fast increase is in keeping with the image of continuing recovery and involves an acceleration of exports. In 2015, household consumption and business investments are also expected to grow. Projections of economic growth for this year and next year, thus, have been upwardly adjusted, compared to those in the Central Economic Plan (CEP) 2015, as a result of the positive realisations over the last quarters.
In the wake of the improving economy, employment is expected to increase both this year and the next. In the market sector, employment will grow by 0.9% in 2015 and 1.5% in 2016. Unemployment will decrease this year to 625,000 people and next year to 600,000. Inflation (HICP) is low in the Netherlands, as in the rest of Europe, but has increased over the last months due to rising oil prices and a lower euro exchange rate compared to the US dollar. This is why this year's projections were upwardly adjusted to 0.2%. For next year, inflation is expected to be 1.2%.
The government deficit will decrease in 2015 to 1.9% of GDP and next year to 0.8%. The continuing economic recovery will have a positive impact on tax revenues, and the expenditure on unemployment benefits will decline. The low interest rates will curb government interest rate expenditure. The decline in natural gas revenues will partly be offset by these factors. Higher interest rates and lower natural gas revenues form a negative risk for the EMU balance, both in this year and the next. In 2016, the government deficit will be reduced by 0.3% of GDP due to an incidental deduction on the Dutch contribution to the European Union. The distance to the EMU balance that was agreed in the Government Agreement, therefore, will be substantially less than current projections suggest.
- Main Conclusions
- Fan Charts
- The table 'Main economic indicators', 2013-2016
- Graph 'Economic growth in the Netherlands, 2008-2016'
- Related Publication
- Appendix: Main Economic Indicators for the Netherlands, 1970-2016
- Appendix: Key data for the world economy and external data for the Netherlands, 1975-2016
Main conclusions
Read the accompanying press release.
Fan Charts
Take a look at the Fan Charts.
Table 'Main economic indicators', 2013-2016
| 2013 | 2014 | 2015 | 2016 | |
|---|---|---|---|---|
| Relevant world trade volume goods and services (%) |
2.2 |
4.0 |
4.0 |
5.2 |
| Export price competitors (goods and services, non-commodities, %) |
-3.2 |
-0.8 |
9.9 |
1.8 |
| Crude oil price (dollar per barrel) |
107.1 |
97.9 |
62.3 |
69.5 |
| Exchange rate (dollar per euro) |
1.33 |
1.33 |
1.10 |
1.10 |
| Long-term interest rate the Netherlands (level in %) |
2.0 |
1.5 |
0.3 |
0.3 |
| 2013 | 2014 | 2015 | 2016 | |
|---|---|---|---|---|
| Gross domestic product (GDP, economic growth, %) |
-0.7 |
0.9 |
2.0 |
2.1 |
| Consumption households (%) |
-1.6 |
0.1 |
1.8 |
1.6 |
| Consumption general government (%) |
-0.3 |
-0.4 |
0.1 |
0.9 |
| Capital formation including changes in stock (%) |
-5.3 |
2.7 |
4.8 |
4.5 |
| Exports of goods and services (%) |
2.0 |
4.0 |
3.0 |
5.2 |
| Imports of goods and services (%) |
0.8 |
4.0 |
3.0 |
5.6 |
| 2013 | 2014 | 2015 | 2016 | |
|---|---|---|---|---|
| Price gross domestic product (%) |
1.1 |
1.1 |
1.1 |
1.1 |
| Export price goods and services (non-energy, %) |
0.3 |
-0.2 |
2.2 |
1.9 |
| Import price goods (%) |
-1.5 |
-3.1 |
-1.8 |
4.1 |
| Inflation, harmonised index of consumer prices (hicp, %) |
2.6 |
0.3 |
0.2 |
1.2 |
| Contractual wages market sector (%) |
1.2 |
1.0 |
1.2 |
1.6 |
| Purchasing power, static, median all households (%) |
-1.3 |
1.4 |
1.0 |
-0.3 |
| 2013 | 2014 | 2015 | 2016 | |
|---|---|---|---|---|
| Labour force (%) |
0.8 |
-0.4 |
0.6 |
0.9 |
| Active labour force (%) |
-0.8 |
-0.6 |
1.1 |
1.3 |
| Unemployment (in thousands of persons) |
647 |
660 |
625 |
600 |
| Unemployed rate (% of the labour force) |
7.3 |
7.4 |
7.0 |
6.7 |
| 2013 | 2014 | 2015 | 2016 | |
|---|---|---|---|---|
| Production (%) |
-1.1 |
2.1 |
2.6 |
2.9 |
| Labour productivity (labour years, %) |
0.3 |
1.6 |
1.7 |
1.4 |
| Employment (labour years, %) |
-1.5 |
0.4 |
0.9 |
1.5 |
| Compensation per employee (%) |
2.6 |
1.9 |
0.7 |
2.8 |
| Labour share in enterprise income (level in %) |
81.4 |
80.4 |
77.7 |
77.9 |
| 2013 | 2014 | 2015 | 2016 | |
|---|---|---|---|---|
| Private savings (% of disposable household income) |
0.6 |
2.0 |
2.4 |
1.2 |
| Current-account balance (level in % GDP) |
8.5 |
9.8 |
10.8 |
10.8 |
| 2013 | 2014 | 2015 | 2016 | |
|---|---|---|---|---|
| General government financial balance (% GDP) |
-2.3 |
-2.3 |
-1.9 |
-0.8 |
| Gross debt general government (% GDP) |
68.6 |
68.5 |
67.6 |
65.4 |
| Taxes and social security contributions (% GDP) |
37.2 |
37.9 |
37.4 |
38.1 |
The wage-rate market sector, labour-income share as well as private savings are biased upward for 2014, 2015 and 2016, due to the measure to limit the use of a so-called Stamrecht bv (severance pay insurance fund). Severance payments will be paid directly to the person involved, instead of into such a fund. After the revision of the National Accounts, severance payments are registered as employers' social security contributions. This translates into a non-recurring increase of the wage rate in 2014 which affects the development of the wages in the private sector well over 0.5% points.
The revision of the Labour Force Survey (Statistics Netherlands) leads to higher unemployment (47,000 in 2013) and a lower active labour force (minus 80,000 in 2013). Therefore, the unemployment rate increases by 0.6 percentage point. In the other years the differences are similar.
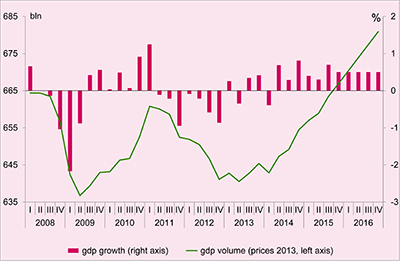
Economic growth in the Netherlands, 2008-2016
Related publication
- CPB Policy Brief 2015/10 "Juniraming 2015" (only in Dutch)
Downloads

Contacts
