June 16, 2014
CPB's short-term forecasts June 2014
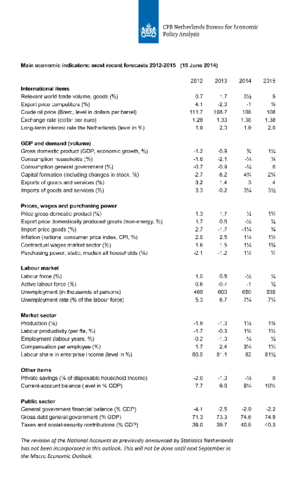
The Dutch economy is projected to grow by ¾% this year, and a slight increase in GDP growth up to 1¼% is projected for next year. Inflation will be low in both years. The EMU deficit is expected to reach 2.2% in 2015. This is the second forecast made in 2014.
- Main Conclusions
- The table 'Main economic indicators', 2012-2015
- Graph 'Economic growth in the Netherlands, 2008-2015'
- Related Publication
- Appendix: Main Economic Indicators for the Netherlands, 1970-2015
- Appendix: Key data for the world economy and external data for the Netherlands, 1975-2015
Main conclusions
Read the accompanying press release.
Table 'Main economic indicators', 2012-2015 (June 2014)
| 2012 | 2013 | 2014 | 2015 | |
|---|---|---|---|---|
| Relevant world trade volume (%) |
0.7 |
1.7 |
3 1/2 |
5 |
| Export price competitors (%) |
4.1 |
-2.0 |
-1 |
3/4 |
| Crude oil price (Brent, level in dollars per barrel) |
111.7 |
108.7 |
108 |
108 |
| Exchange rate (dollar per euro) |
1.28 |
1.33 |
1.38 |
1.38 |
| Long-term interest rate the Netherlands (level in %) |
1.9 |
2.0 |
1.9 |
2.0 |
| 2012 | 2013 | 2014 | 2015 | |
|---|---|---|---|---|
| Gross domestic product (GDP, economic growth, %) |
-1.2 |
-0.9 |
3/4 |
1 1/4 |
| Consumption households (%) |
-1.6 |
-2.1 |
-1/4 |
3/4 |
| Consumption general government (%) |
-0.7 |
-0.9 |
-1/4 |
0 |
| Capital formation including changes in stock (%) |
-2.7 |
-6.2 |
4 3/4 |
2 1/4 |
| Exports of goods and services (%) |
3.2 |
1.4 |
3 |
4 |
| Imports of goods and services (%) |
3.3 |
-0.2 |
3 1/4 |
3 1/2 |
| 2012 | 2013 | 2014 | 2015 | |
|---|---|---|---|---|
| Price gross domestic product (%) |
1.3 |
1.7 |
1/2 |
1 1/4 |
| Export price domestically produced goods (non energy, %) |
1.7 |
0.6 |
-1/2 |
3/4 |
| Import price goods (%) |
2.7 |
-1.7 |
-1 1/4 |
3/4 |
| National consumer price index (CPI, %) |
2.5 |
2.5 |
1 1/4 |
1 1/2 |
| Contractual wages market sector (%) |
1.6 |
1.5 |
1 1/4 |
1 3/4 |
| Purchasing power, static, median all households (%) |
-2.1 |
-1.2 |
1 1/2 |
1/4 |
| 2012 | 2013 | 2014 | 2015 | |
|---|---|---|---|---|
| Labour force (%) |
1.5 |
0.8 |
-1/2 |
1/4 |
| Active labour force (%) |
0.6 |
-0.7 |
-1 |
1/2 |
| Unemployment (in thousands of persons) |
469 |
600 |
650 |
635 |
| Unemployed rate (% of the labour force) |
5.3 |
6.7 |
7 1/4 |
7 1/4 |
| 2012 | 2013 | 2014 | 2015 | |
|---|---|---|---|---|
| Production (%) |
-1.9 |
-1.3 |
1 1/2 |
1 3/4 |
| Labour productivity (labour years, %) |
-1.7 |
-0.3 |
1 3/4 |
1 1/4 |
| Employment (labour years, %) |
-0.2 |
-1.0 |
-1/4 |
1/2 |
| Compensation per employee (%) |
1.7 |
2.4 |
3 1/4 |
1 1/2 |
| Labour share in enterprise income (level in %) |
80.5 |
81.1 |
82 |
81 1/2 |
| 2012 | 2013 | 2014 | 2015 | |
|---|---|---|---|---|
| Private savings (% of disposable household income) |
-2.0 |
-1.0 |
-1/2 |
0 |
| Current-account balance (level in % GDP) |
7.7 |
9.6 |
9 1/4 |
10 1/4 |
| 2012 | 2013 | 2014 | 2015 | |
|---|---|---|---|---|
| General government financial balance (% GDP) |
-4.1 |
-2.5 |
-2.9 |
-2.2 |
| Gross debt general government (% GDP) |
71.3 |
73.3 |
74.6 |
74.9 |
| Taxes and social security contributions (% GDP) |
39.0 |
39.7 |
40.8 |
40.3 |
Economic growth in the Netherlands, 2008-2015

Related publication
- CPB Policy Brief 2014/05 "Juniraming 2014" (only in Dutch)
Downloads
English, Pdf, 1.5 MB
English, Excel, 32 KB
English, Excel, 68.5 KB
